
This issue of VEEN was originally published as a .PDF in April 2023, and posted online. That issue is now archived, but accessible on the VEEN Archive webpage
VEEN is curated by WSU Viticulture Extension. For questions on articles, or to request to submit an article in future issues, reach out to Michelle Moyer.
A Note from the Editor:
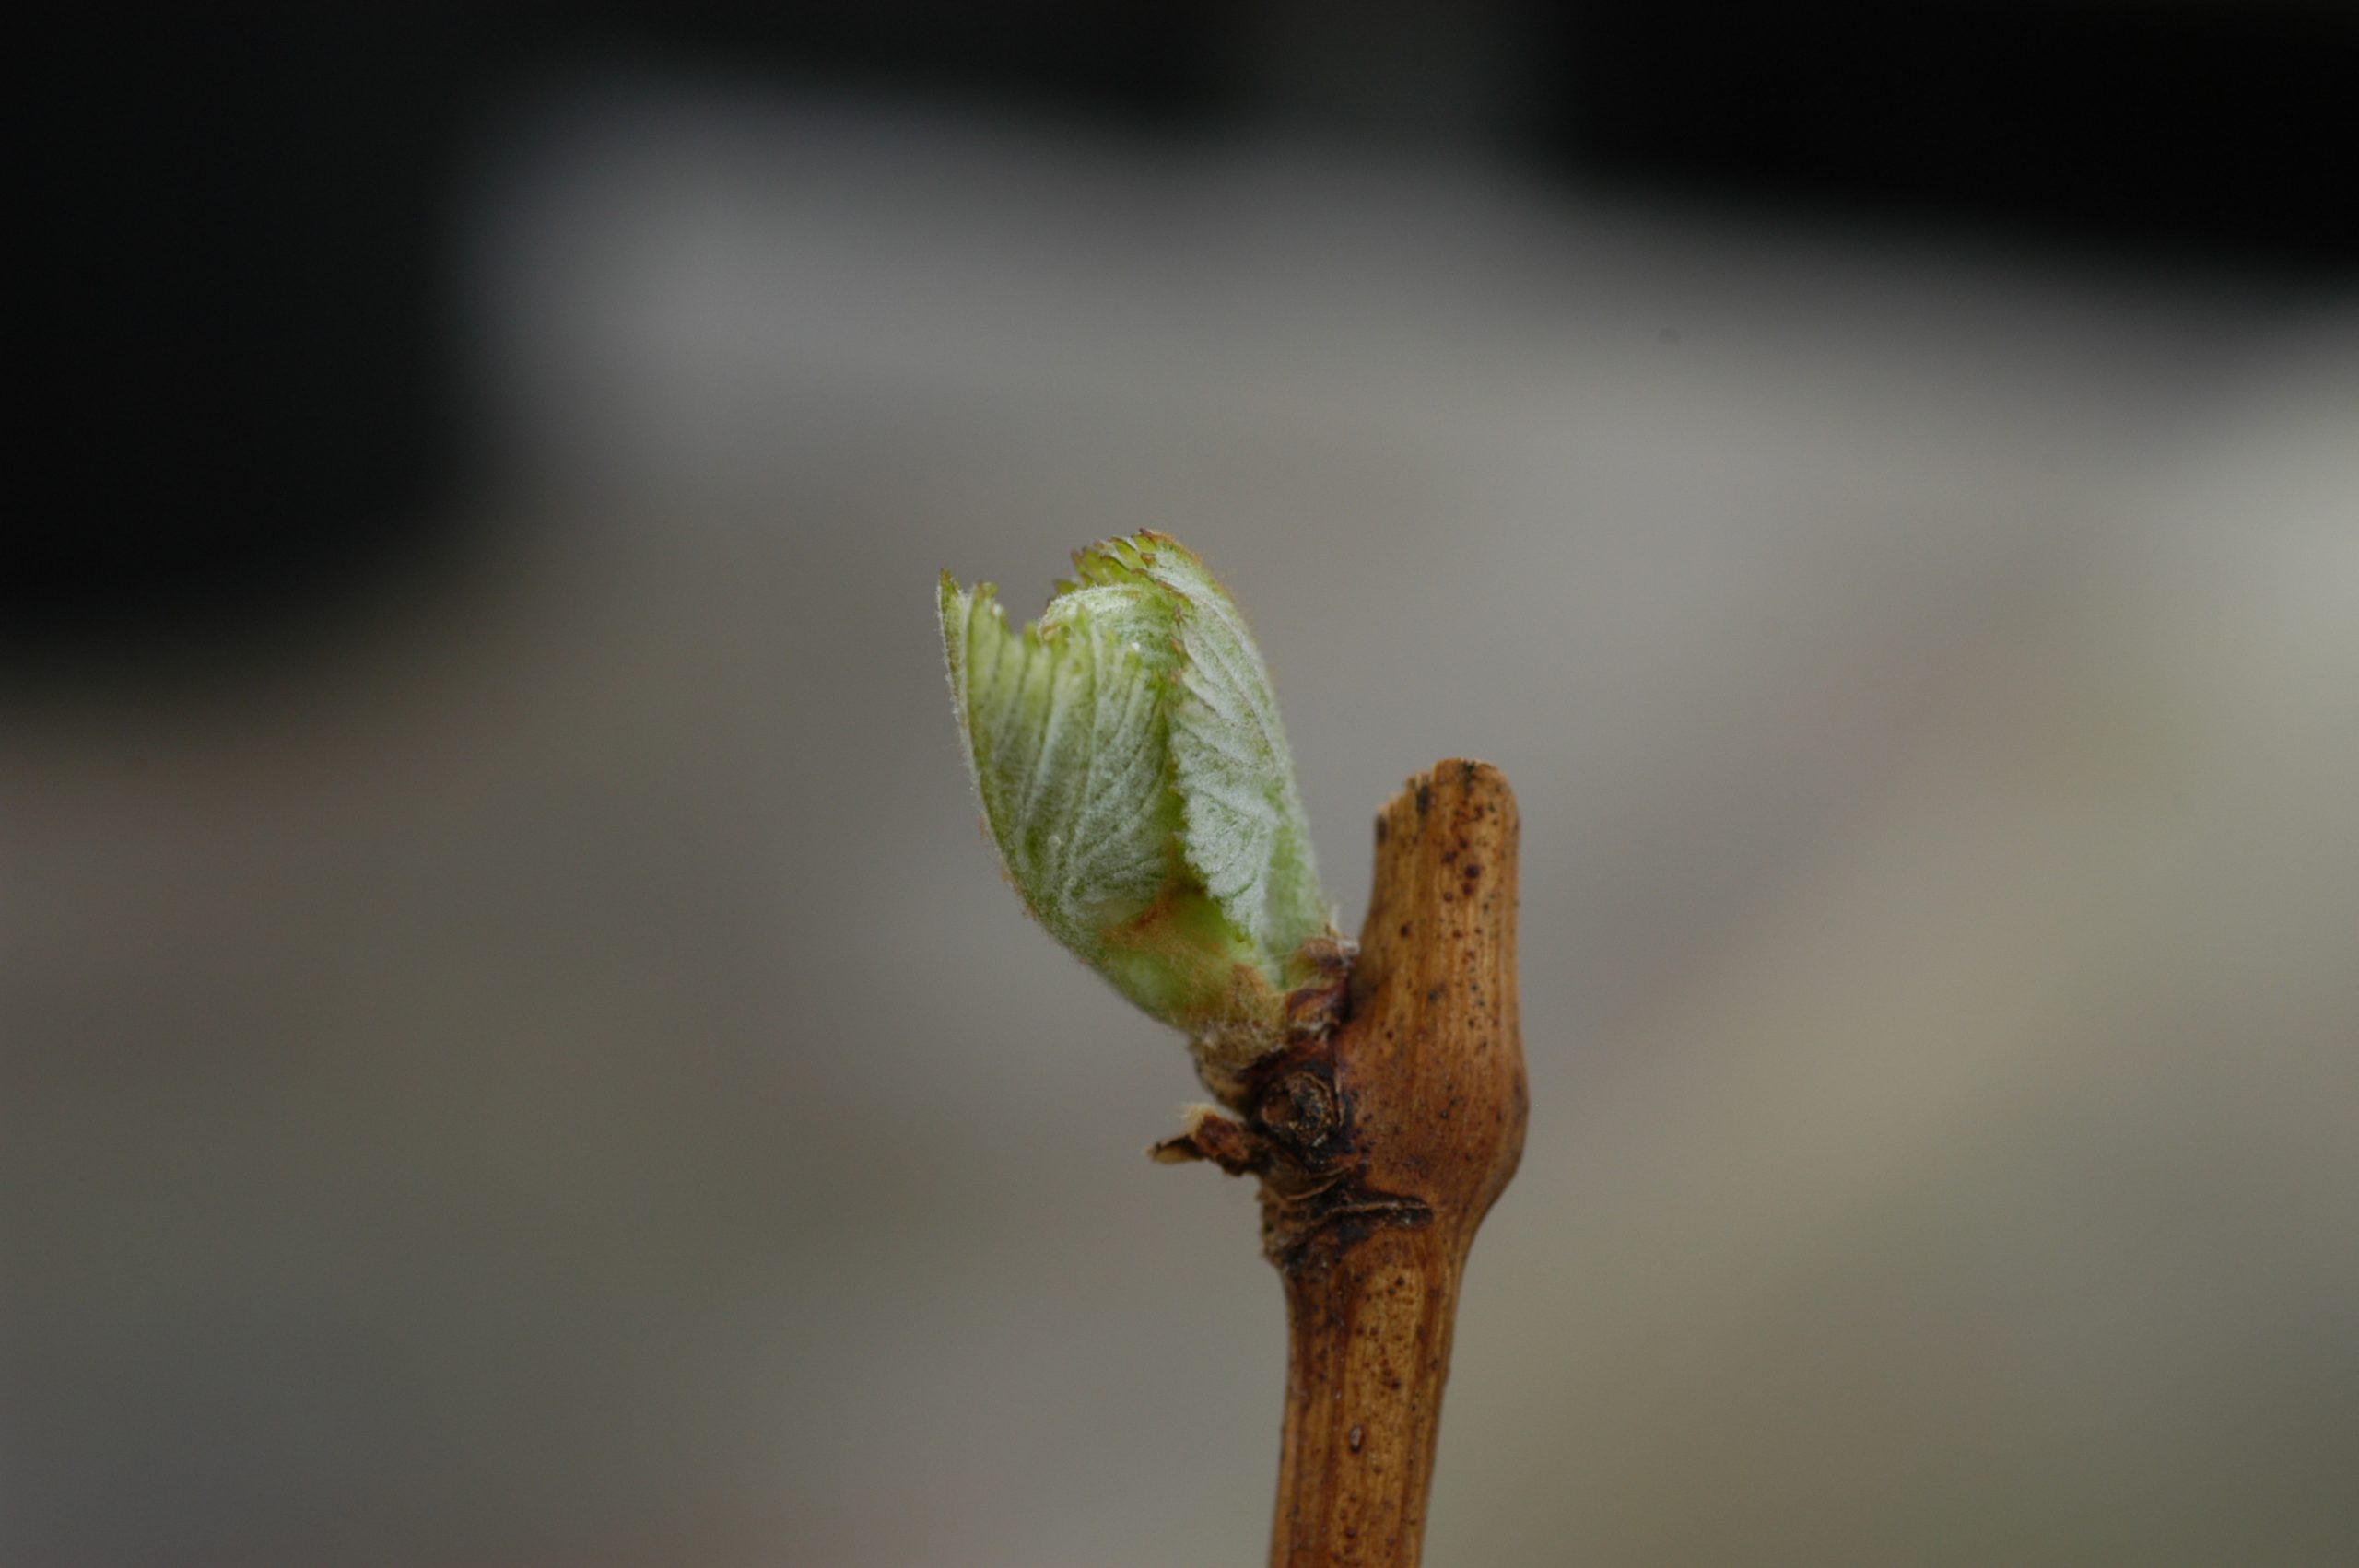
This time last spring, the vines were pushing, but also covered in heavy random spring snow. This year, while we are clear and sunny, things are moving a little more slowly than what recent memory serves. But that is okay, as a slower start means a potentially reduced risk for frost damage. But this delay isn’t really that much of a delay — thus far, we appear to be tracking the long-term average for first budbreak. Sometimes being average is the aspiration.
For those who have not heard, Washington State University elevated the Viticulture and Enology Program, to Department status on January 1. Leading us is Dr. Jean Dodson-Peterson, who began her chair duties last fall. Keep a look out for news and more information rolling out from WSU V&E, as exciting things are coming!
Equally exciting are some of our stories in this issue of VEEN — from waging a biological war against mealybugs to long-term forecasts now integrated into AgWeatherNet, WSU faculty, staff, and students have been busy!
As always, thank you for reading VEEN!
Michelle M. Moyer
Viticulture Extension Specialist
WSU Prosser IAREC
Table of Contents
The Biological War on Mealybugs and Mites: Report from Red Mountain
Author: David G. James, WSU Prosser
Every year, Washington grape growers wage battle as part of an ongoing war on a range of pests including two of the most important affecting wine grape production, mealybugs and spider mites. Mealybugs transmit leaf roll viruses and spider mites have the potential to suck grape leaves dry in the heat of summer. Much of the war against these pests is biological with armies of natural enemies on the front lines, suppressing populations. While the efforts of these natural armies of parasitic wasps, ladybeetles, predatory bugs, predatory mites, and many others, are considerable, they sometimes need extra help.
A new private industry (UAV-IQ) and WSU project (Using Drones and an Attractant to Improve Biological Control of Mealybugs and Spider Mites in Washington Wine Grapes) funded by the Washington Wine Commission in 2022 is investigating ways of providing reinforcements for this natural ground army, when and where they are needed most, which is usually in the middle of a long, hot summer. Bringing in reinforcements often known as ‘augmentative biological control’ is not a new idea, but the way we are doing it, is.
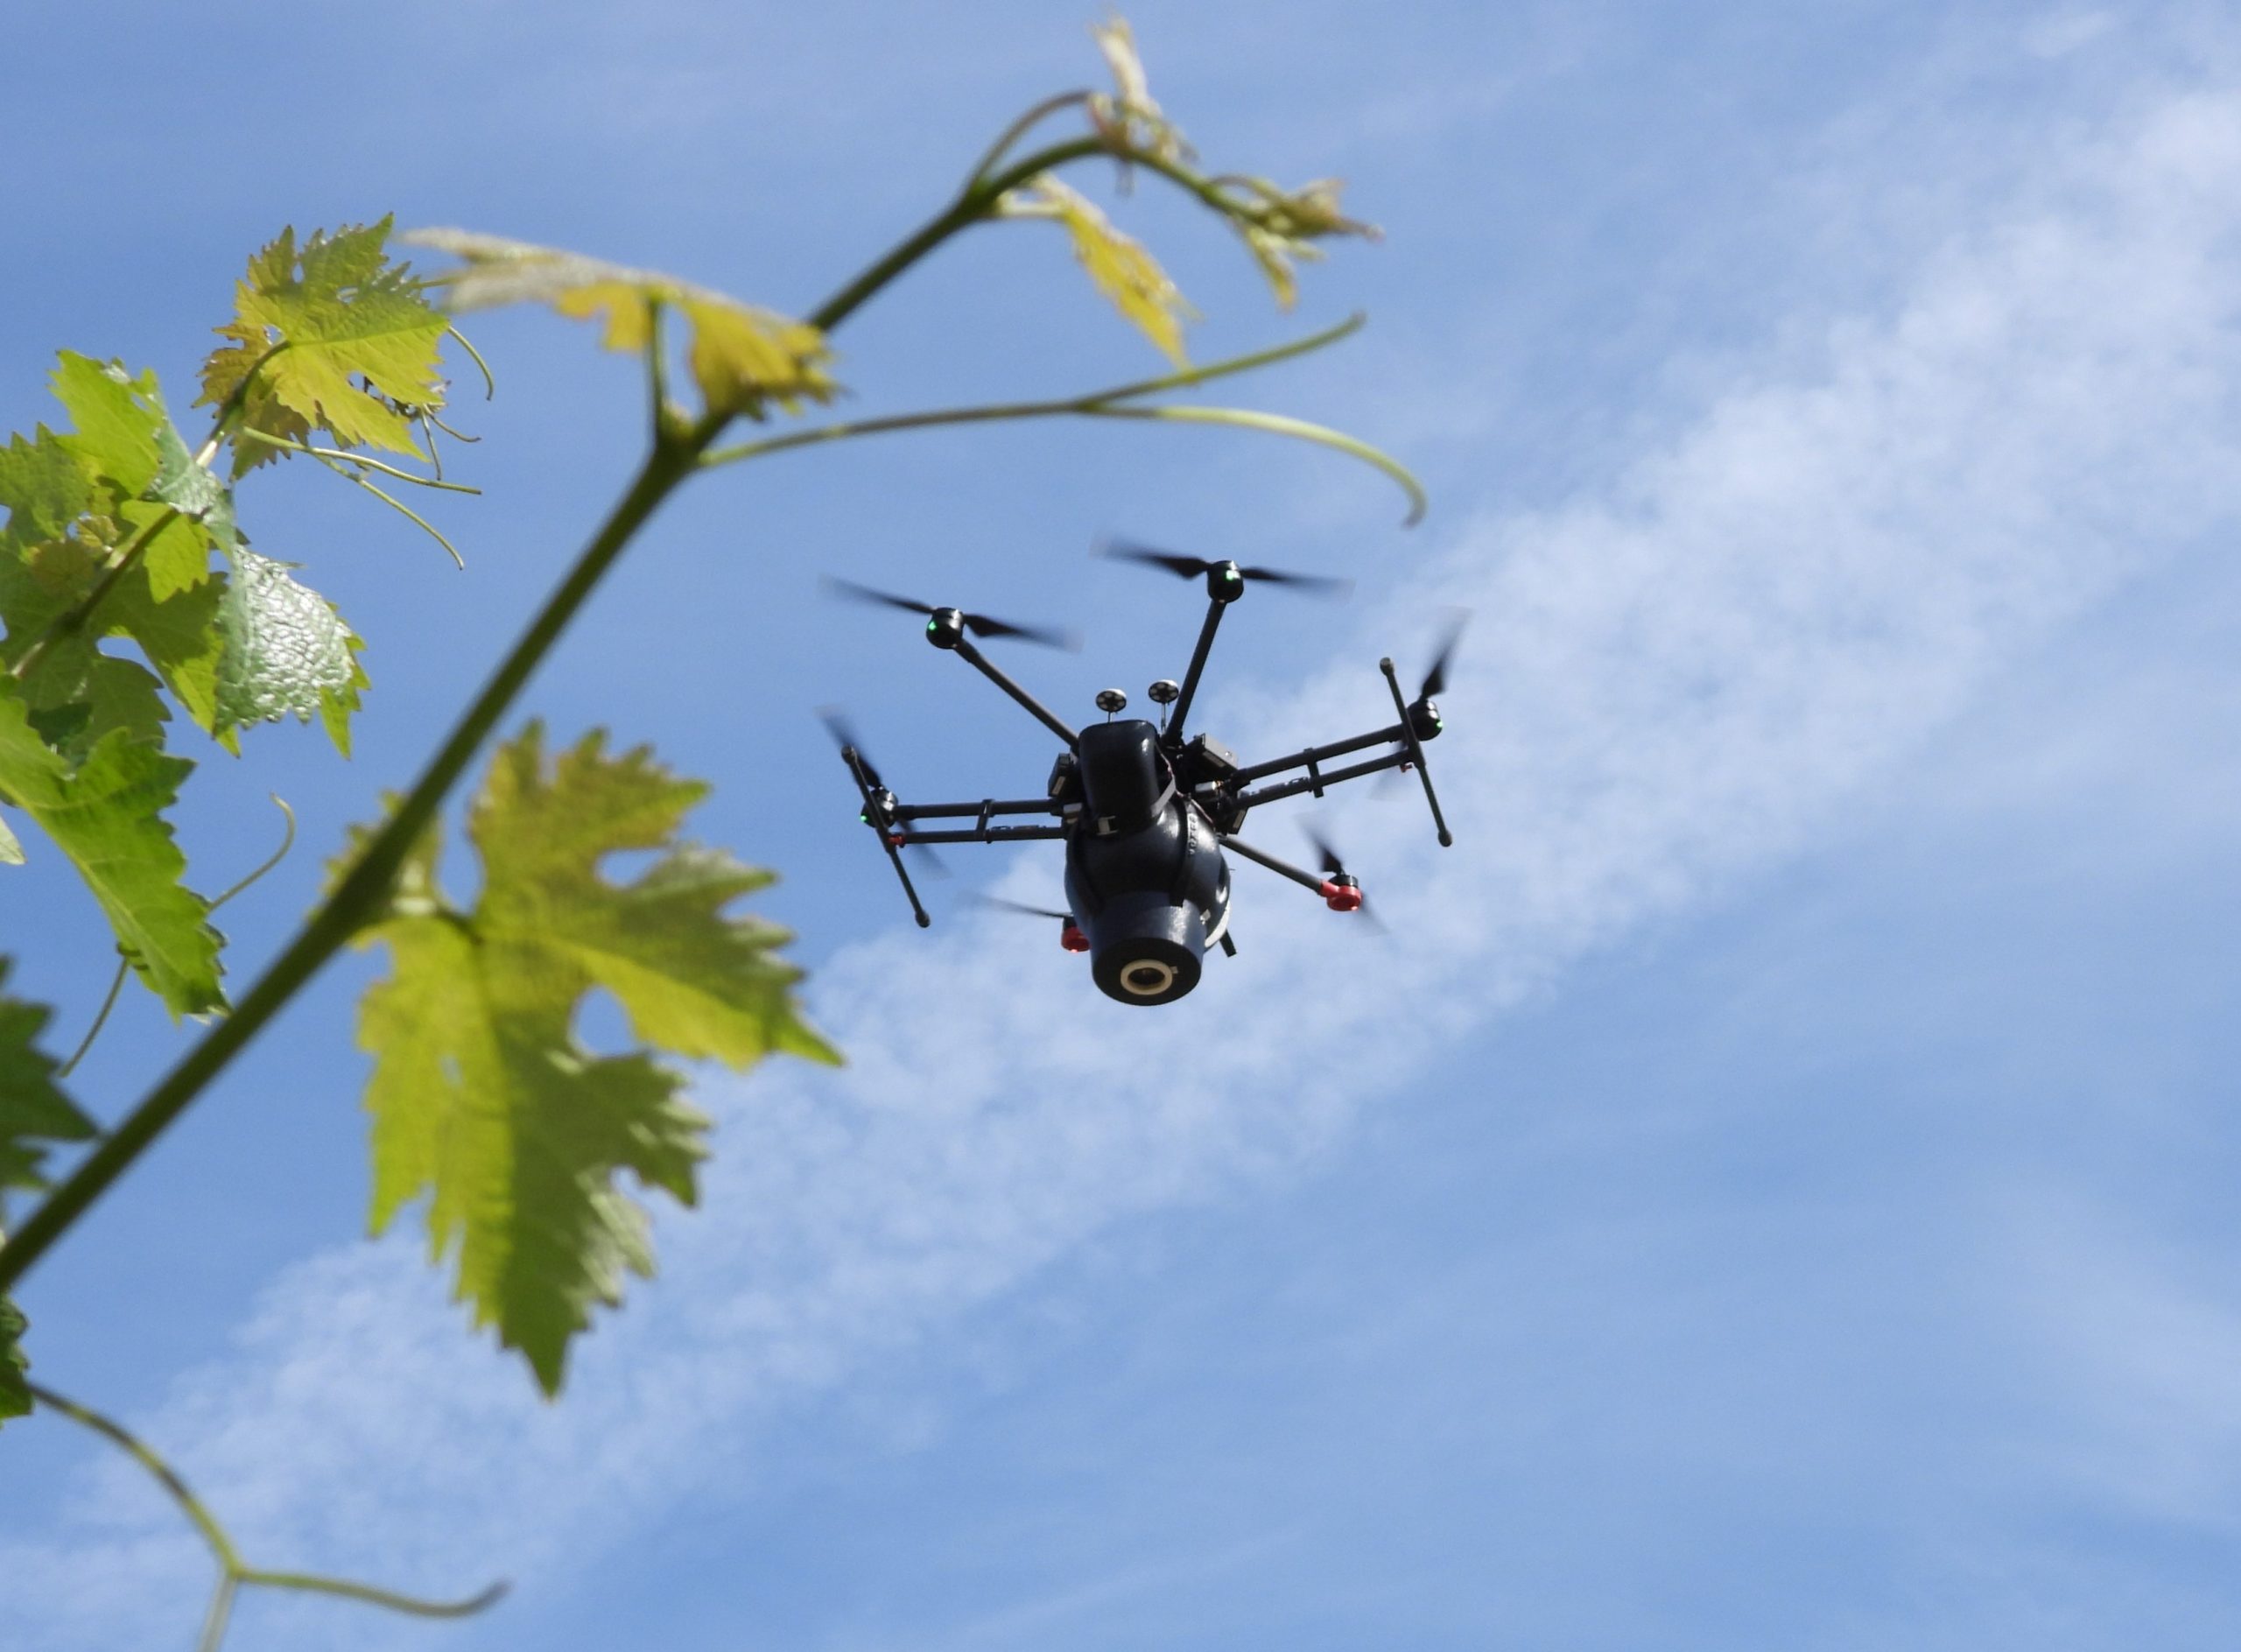
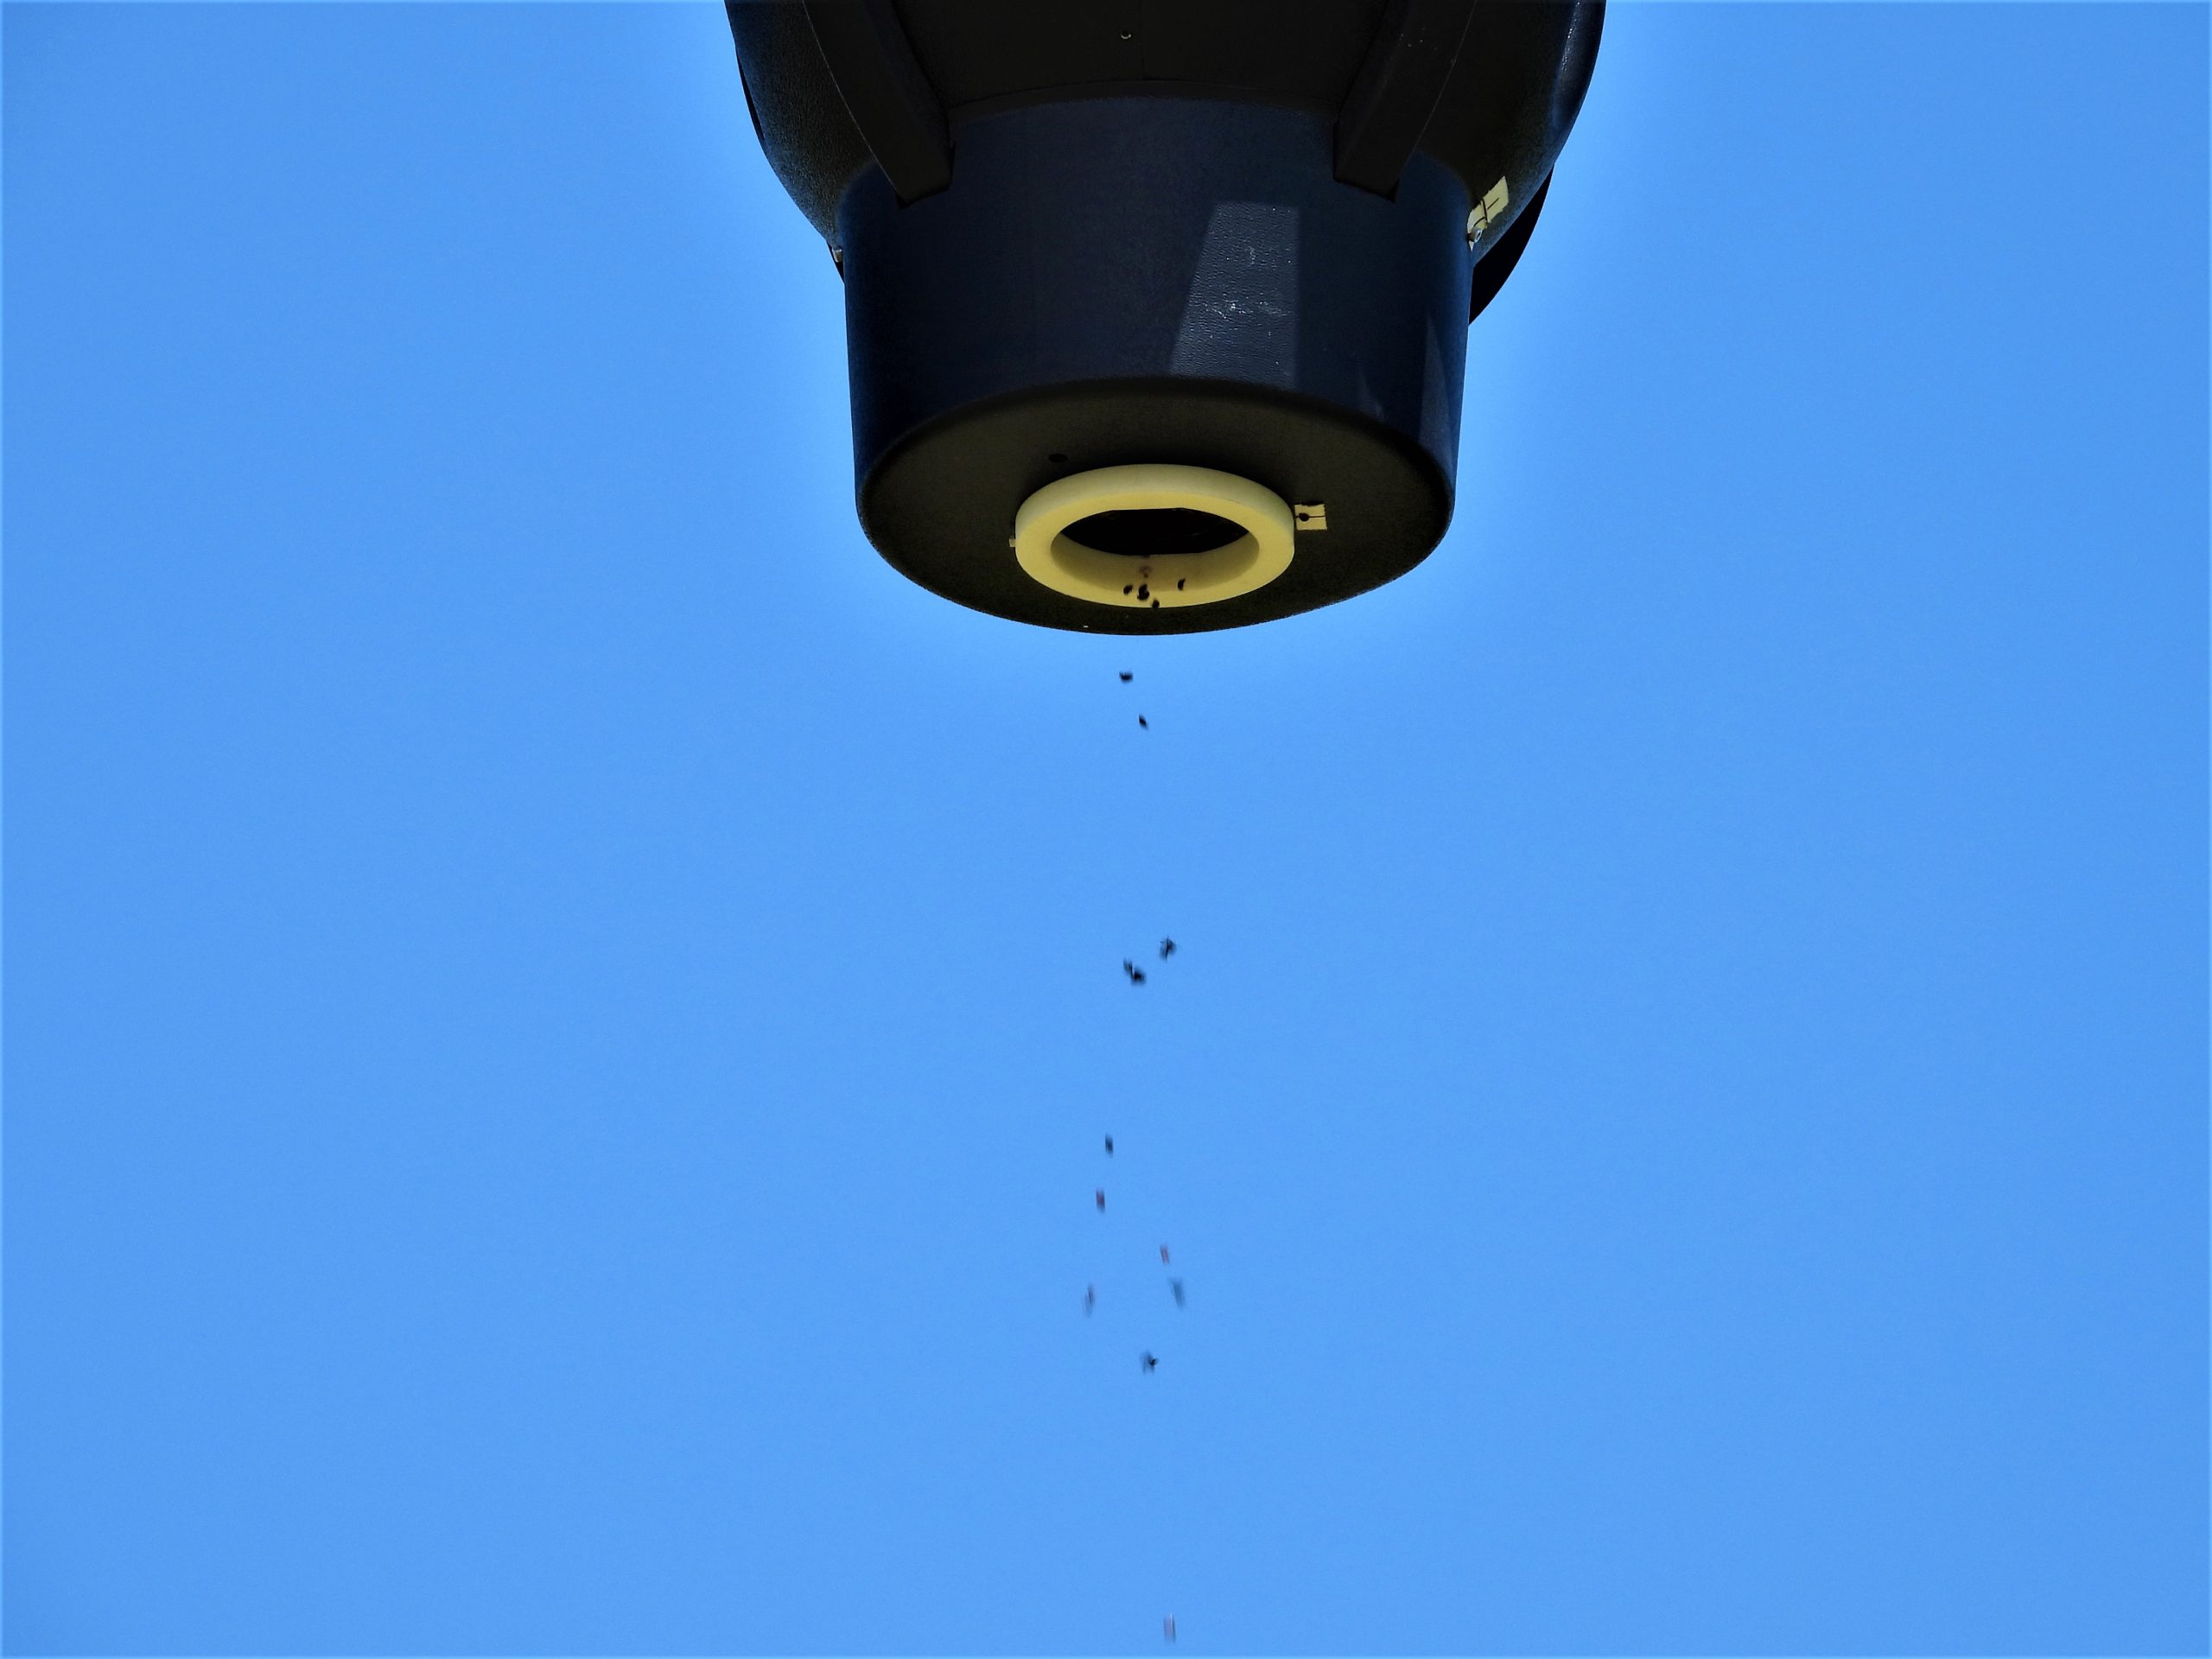
We have taken our war to the skies, by ‘paratrooping’ in squadrons of ‘Mealybug Destroyer’ beetles and battalions of predatory mites, hastening death for mealybugs and spider mites. Our aerial assault is facilitated by unmanned aerial vehicles (UAV’s or drones) that possess speed, maneuverability, and lethal accuracy (Fig. 1).
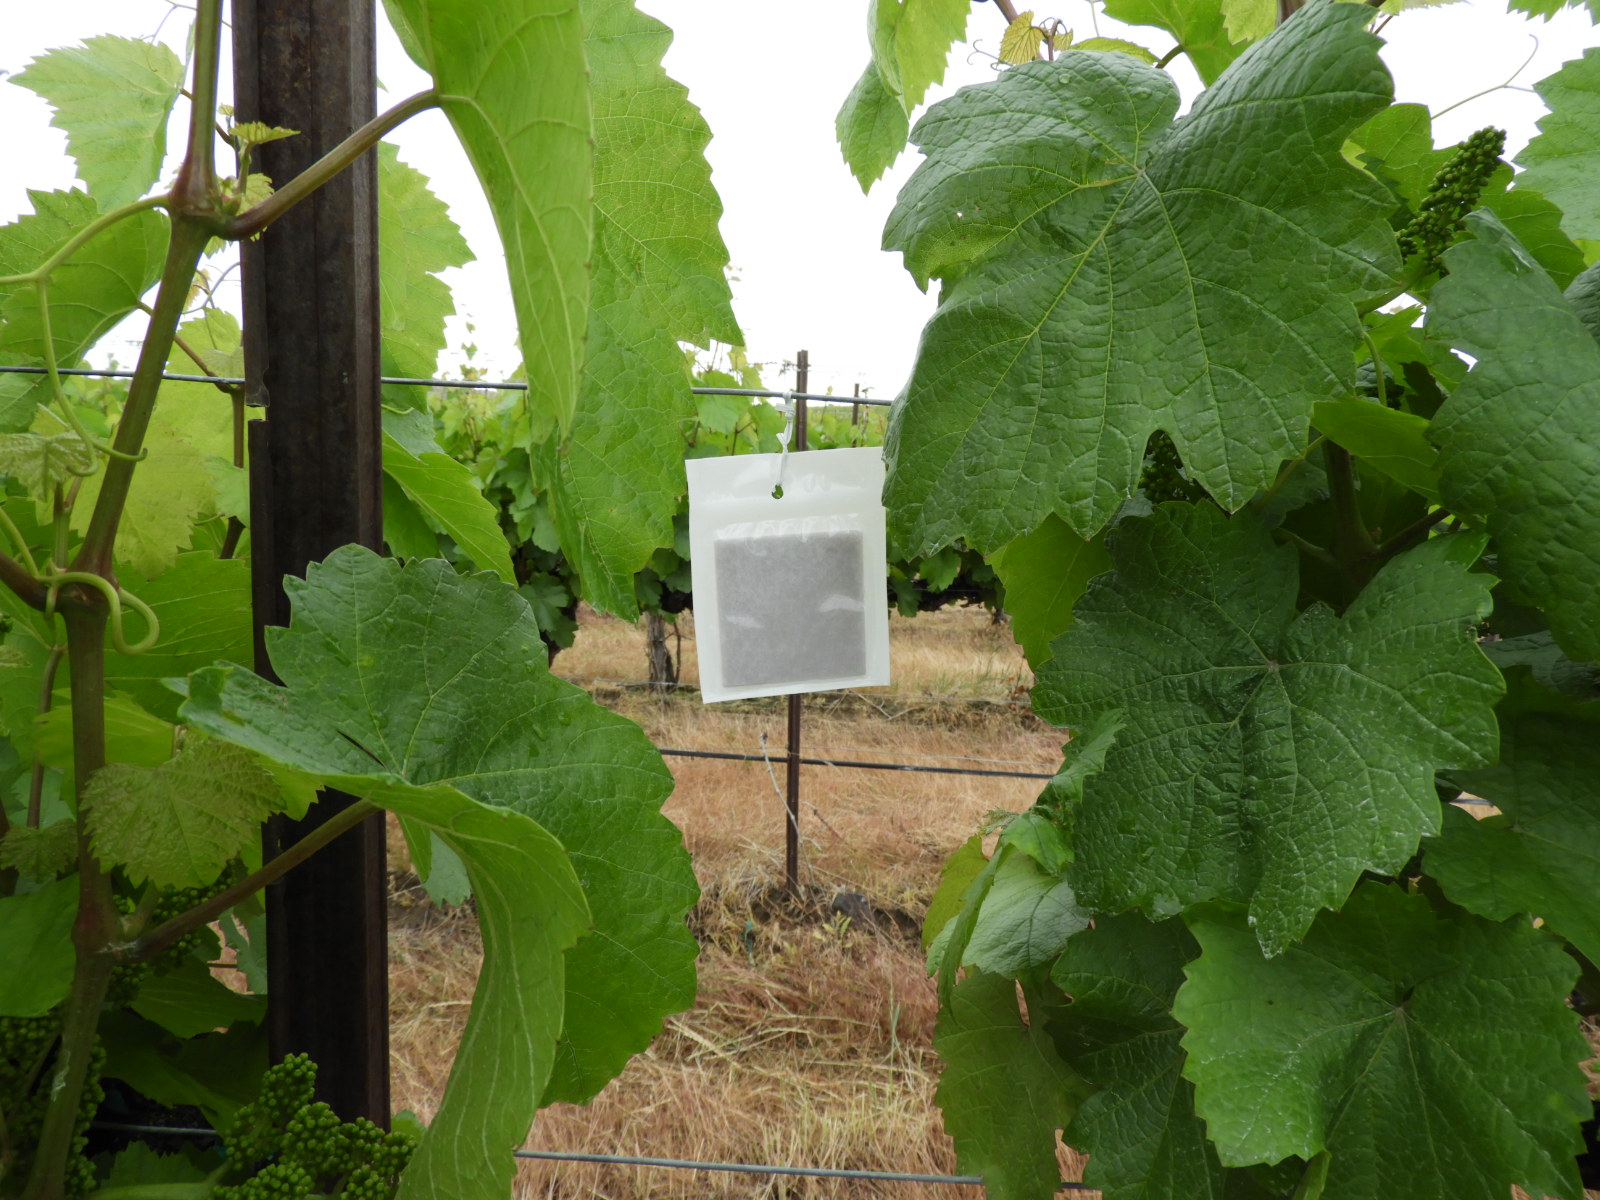
In addition, we are recruiting enhanced numbers of ground troops by deploying a gas that brings in entomological militia from elsewhere. This gas, known as methyl salicylate (MeSA), was proven in research conducted by our laboratory at WSU-Prosser almost two decades ago, to attract large numbers and a diverse community of natural enemies to vineyards. The time is now right to show how well this predator army-recruiting gas can work in Washington vineyards (Fig. 2).
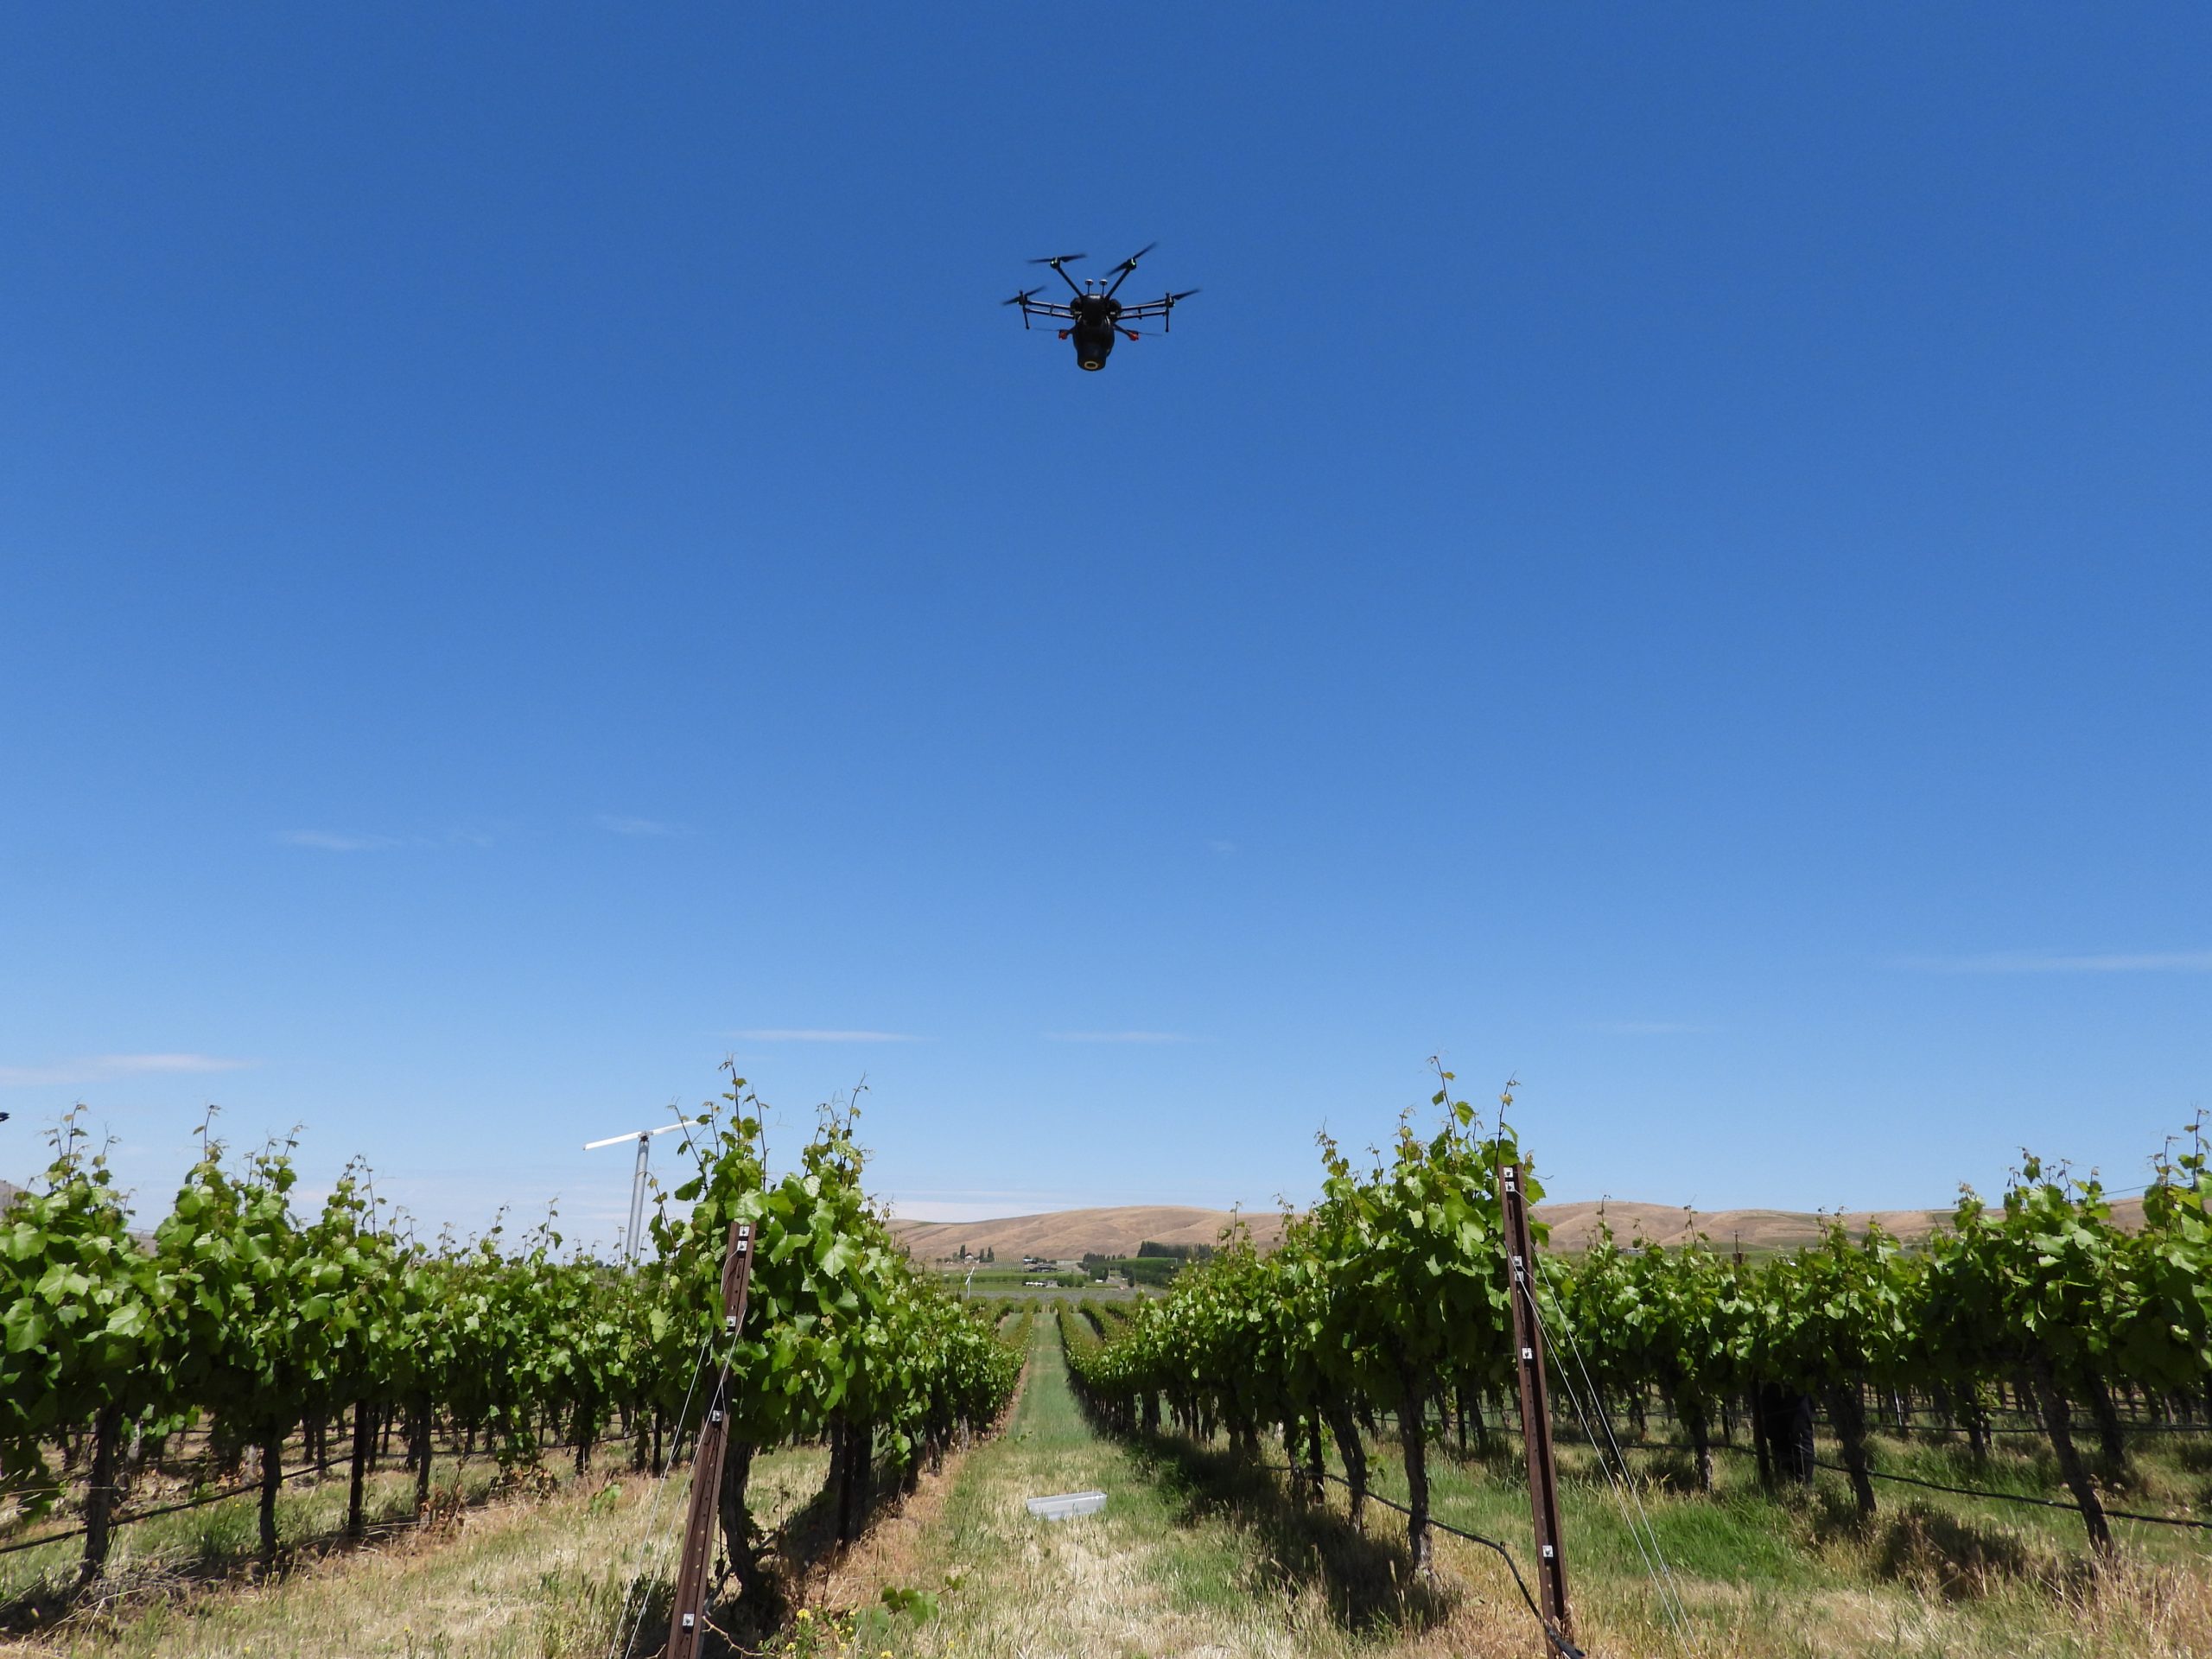
Our battleground last summer was a vineyard on Red Mountain (Fig. 3). The long, cool spring of 2022 worked in our favor by preventing mobilization of enemy regiments until the middle of June. Our first aerial assault occurred just after D-day on June 15 when a single UAV, supplied and guided by our military partners from California (UAV-IQ) dropped 500 Mealybug Destroyers and 50,000 predatory mites over each acre of grapevines.
Our ground initiative started earlier at the beginning of June when we deployed 20 slow-release dispensers of methyl salicylate per acre, to attract armies of predators and parasitoids from nearby habitats, to strengthen our ground troops. A follow-up aerial assault took place in early August to bolster the in-roads that the mid-June paratroopers had made. This assault, on August 11, was unfortunately marred by extremely hot weather that impacted the ability of troops to fight and find shelter once they reached the ground.
However, overall, the war went well and mealybug and mite numbers in our grapevine battlefields did not approach damaging levels. Spider mite populations in particular suffered a crushing defeat with 5-10 times fewer mites on grapevines exposed to aerial and enhanced land assault from predators, than grapevines in the demilitarized/untreated zone (Fig. 4).
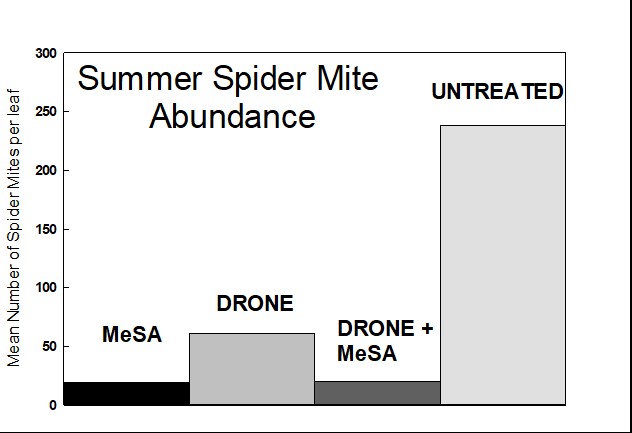
The Mealybug Destroyer regiment met tough resistance in their skirmish with mealybugs but still managed to reduce populations by 15-30-% (Fig. 5).
Post-battle debriefing celebrated the fact that our mission to increase the numbers of predator troops in the vineyard, was very successful.
Aside from the direct augmentation of ground forces via our coordinated aerial invasion of Mealybug Destroyers and predatory mites, we saw a substantial boost to predator units on the ground in response to our deployment of methyl salicylate gas. Regiments and divisions of combat squads such as lacewings, ladybeetles, predatory flies, and predatory bugs, all responded in great numbers, thus ensuring maximum engagement and impact on the enemy. Our war generals are convinced that it was the combination of aerial assault and enhanced ground battalions, that handed us our victory in the battle of Red Mountain in 2022.
This coming summer we hope to repeat the exciting military tactics that we deployed and tested on Red Mountain in 2022. We may make some modifications to the battle plan including substituting a new battalion of predatory mites known as Galendromus. The fighting unit we used in 2022, californicus, did not appear to survive as well under Washington conditions as they do in their native California. Galendromus is a well-known Washington infantry division of predatory mites with much experience in desert combat, so they should be more effective. We will also time our aerial assaults to avoid the heat of the day, giving our beetle squadrons and predatory mite battalions, more time, space and comfort to set up battle positions.
Our ongoing war against wine grape pests in Washington has been reasonably sustainable for some years now. However, we see the advancements we made in tactics and strategies in 2022, as a positive step towards improved sustainability. We prosecuted the war against mealybugs and mites more effectively, with fewer chemical inputs and with less cost. Stay tuned for our 2023 battle report from the killing fields of Red Mountain.
AgWeatherNet Station-Specific 10-Day Weather Forecast Available!
Authors: Matthew D. Cann, Sean Hill and Lav R. Khot, WSU AgWeatherNet
Accurate weather forecasts are needed to make informed management decisions in tree fruit, grapevine, and berry crops. AgWeatherNet (AWN) has responded by developing station-specific weather forecasting models that reduce error by as much as 25-50%. Regional weather forecasts currently available from the National Weather Service or other providers often over generalize conditions in agricultural areas due to their coarsely gridded framework. AWN users have developed a keen understanding of how the weather at particular station(s) relates to their fields and orchards. As a step forward, AWN is developing station-specific 10-day weather forecasts which are available at https://weather.wsu.edu/?p=120850&mobile.
How Station-Specific AWN Weather Forecasting Works
Systematic biases exist between the regional gridded forecast and a given weather station that can be corrected. The gridded framework is limited in areas of complex terrain where elevation, slope angle, and aspect vary within one grid space (e.g., 1.6 x 1.6 mile [2.5 x 2.5 km]) as it can only represent one elevation of leveled terrain, typically an average of the elevation in the entire space. Thus, station-specific models may not be needed in areas of vast, flat terrain. However, any space with rolling hills, mountains, or canyons/gorges frequently find that a gridded forecast product is highly inaccurate.
For example, the Snipes Mountain AVA represents an isolated mountain in a generally wide valley basin. Snipes Mountain is narrow enough that a gridded weather product will include the ridge and either side of the valley in a single grid, making it impossible to deliver an accurate forecast across elevation. This problem is exacerbated by overnight temperature inversions that can vary by 20°F from the ridge to the valley. Station specific forecasts for the Snipes Mountain weather station has shown the greatest improvement across all AWN stations. One day (24 hour) air temperature forecasts have reduced the forecast error by 40% compared to gridded products. Forecast error is reduced by at least 20% out to five days. Temperature forecasts in the Naches Heights AVA are also substantially improved as well as many other areas, especially with complex terrain features. These and similar topographically challenging areas also tend to be some of the most difficult for meteorologists to forecast, demonstrating a strong need for improved station-specific forecasts.
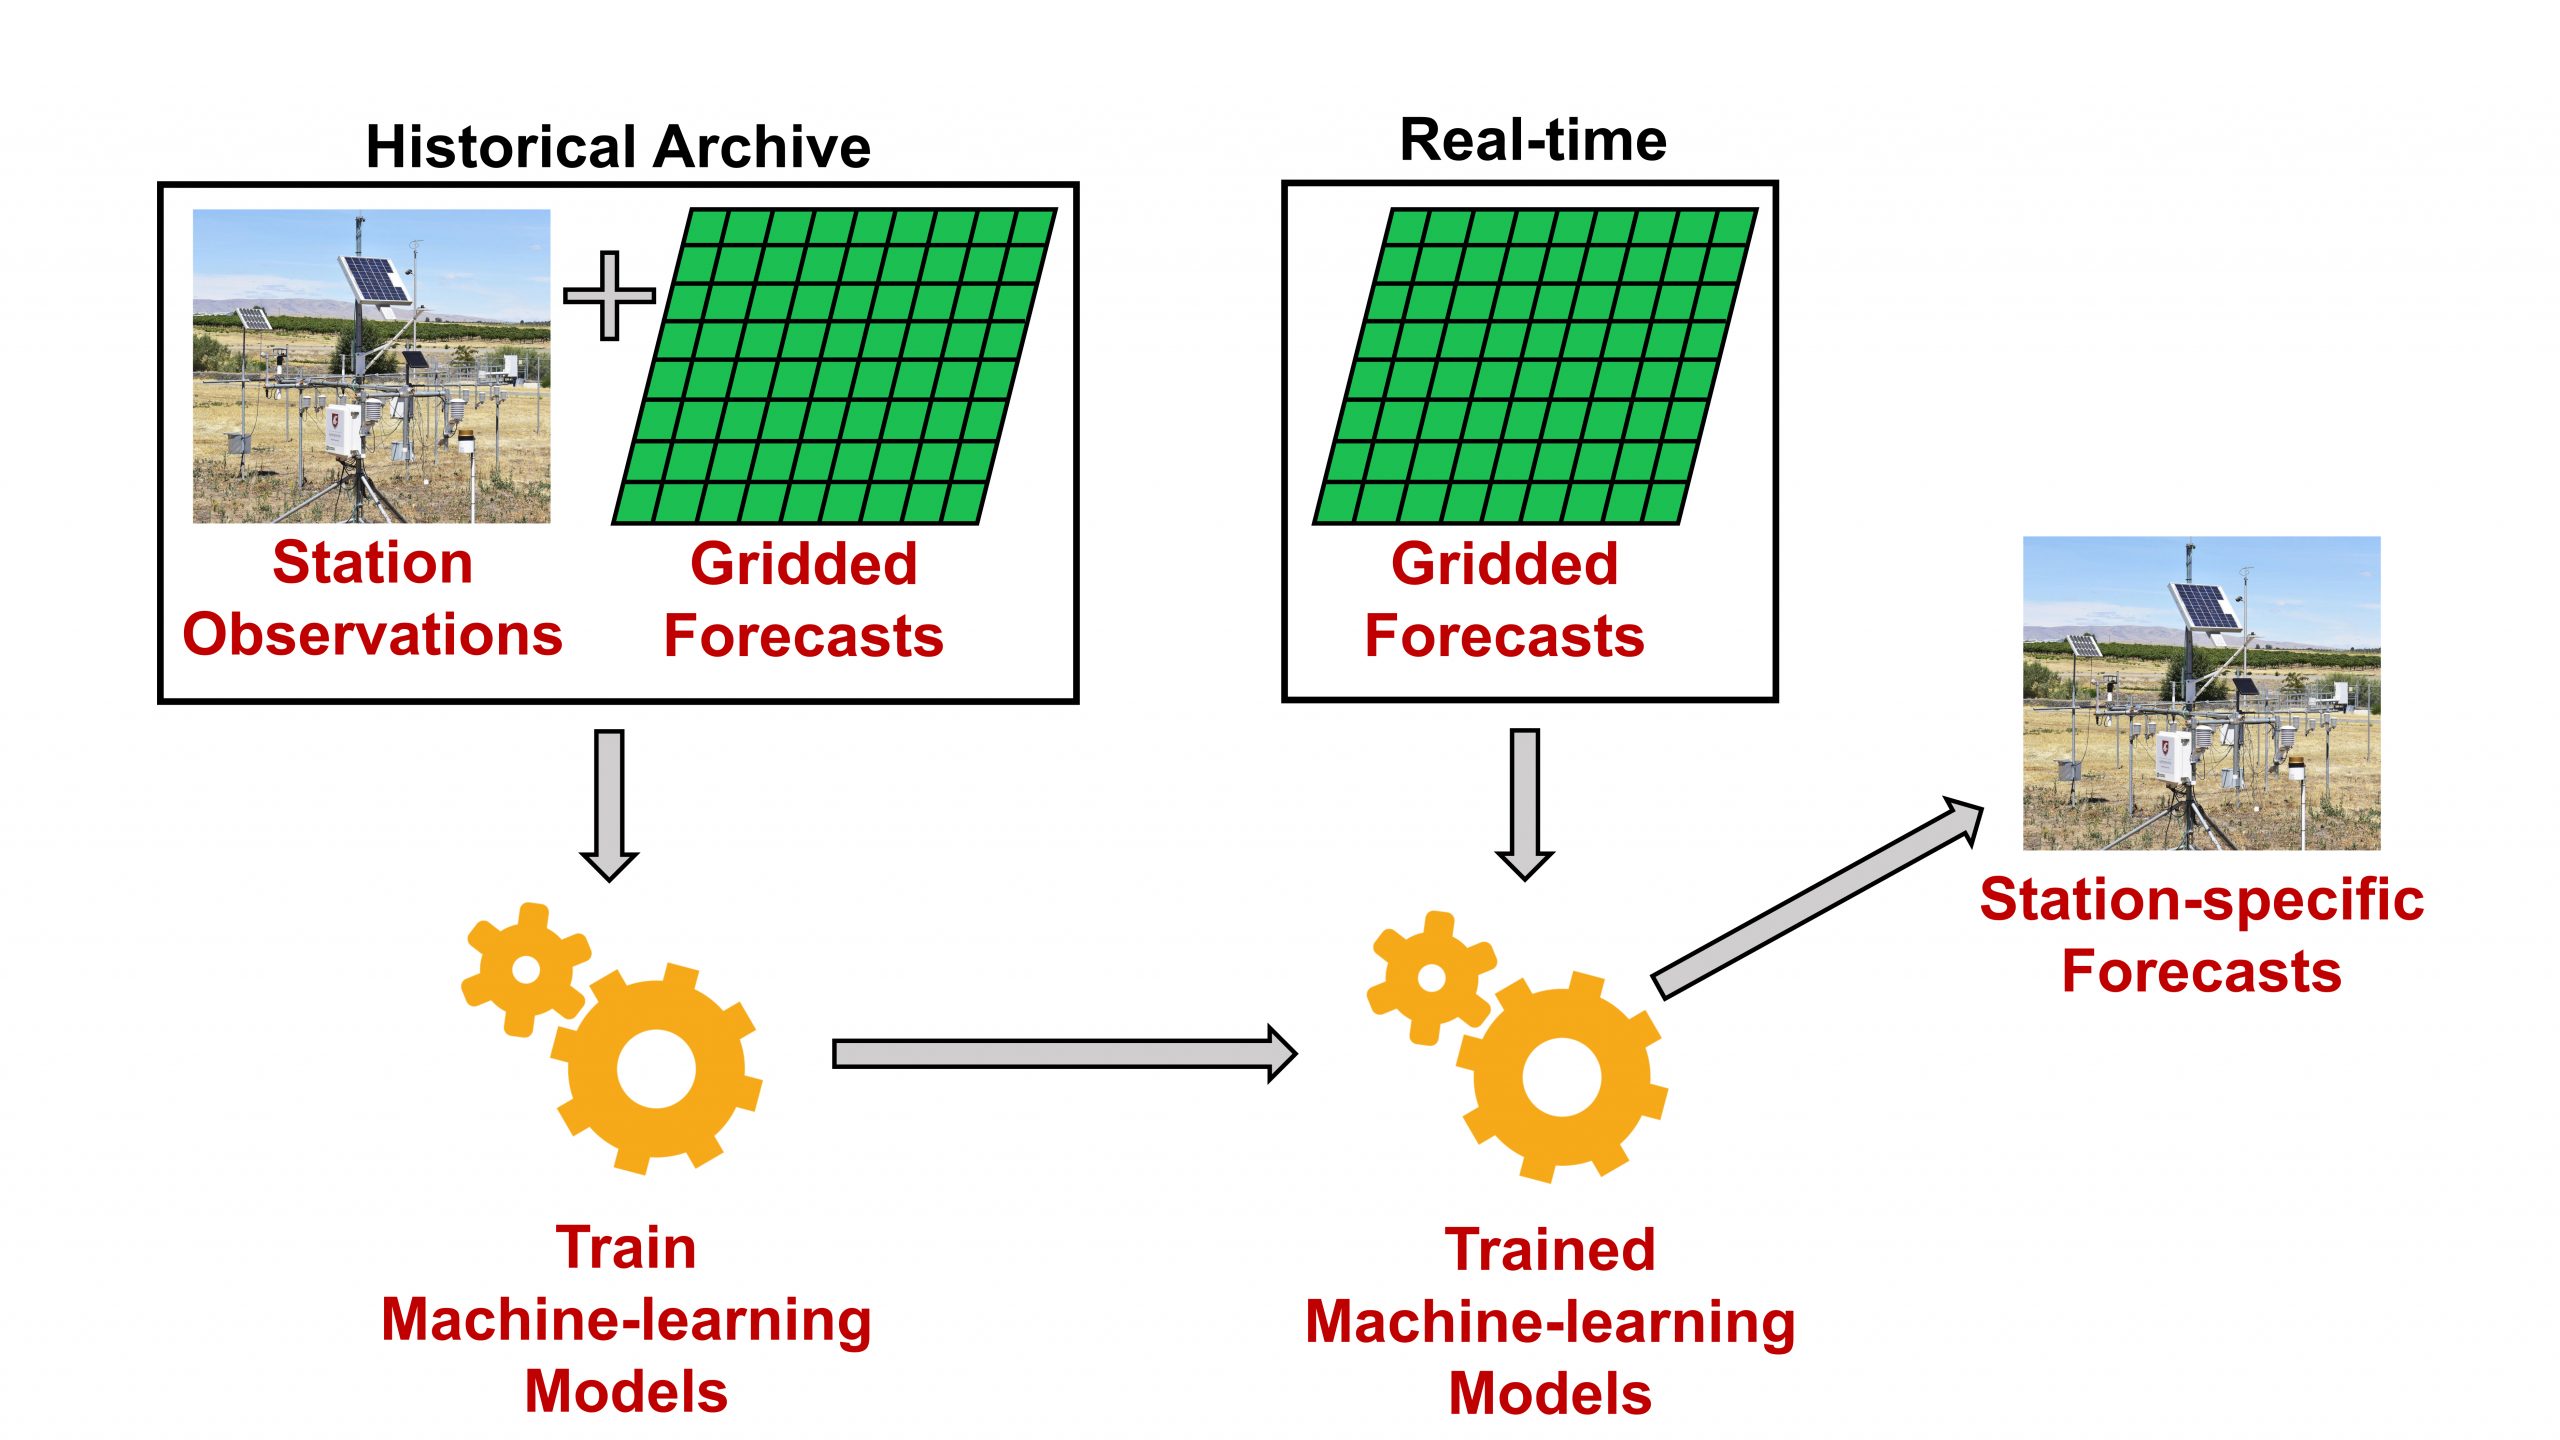
The simplified approach of creating a station-specific weather model and how it is used in real time is shown in Fig. 1. First you acquire archived station observations and gridded forecasts from a number of numerical weather prediction models. Then you train the models to make the correction based on the data. Using this approach, AWN currently provides forecasts for 160+ Tier 1 and 2 weather stations. At least one year of archived weather observations is preferred for modeling, and we are working on additional AWN station-specific models as that archive data becomes available.
The AWN forecast model is presently trained using historical gridded forecasts from three numerical weather prediction models: a global ensemble model, the Global Ensemble Forecast System (GEFS), a high-resolution model, the High Resolution Rapid Refresh (HRRR), and the National Weather Service’s blend of models (NBM), which combines numerical weather prediction models from across the globe to provide high-accuracy forecasts.
The observations and weather model data are then cleaned for errors and ingested into machine-learning models. We use supervised machine-learning models that essentially fit a mathematical formula to transform the input data to predict the outcome. The “supervised” aspect of the models means that we verified weather data from our stations, so we can tell the model what to predict. More observations means more accurate models because they are trained on additional independent weather events and are better able to fit the appropriate formula to predict future weather. A suite of machine-learning models were tested to find the best one for predicting each weather variable. A multiple linear regression model is used for air temperature, dewpoint temperature, relative humidity, inversion strength, and soil temperature, a k-nearest-neighbors model is used for solar radiation, and a random forest model is used for wind speed, gust, and direction predictions.
Trained models are then employed in real time (Fig. 1). The same gridded forecasts used to train the machine-learning models are obtained in real time and the data is converted to match the input of the trained models. The models use the real-time gridded model forecast and recent station observations to convert the inputs into station-specific forecasts with improved accuracy.
Real-time Weather Forecasts and Uses
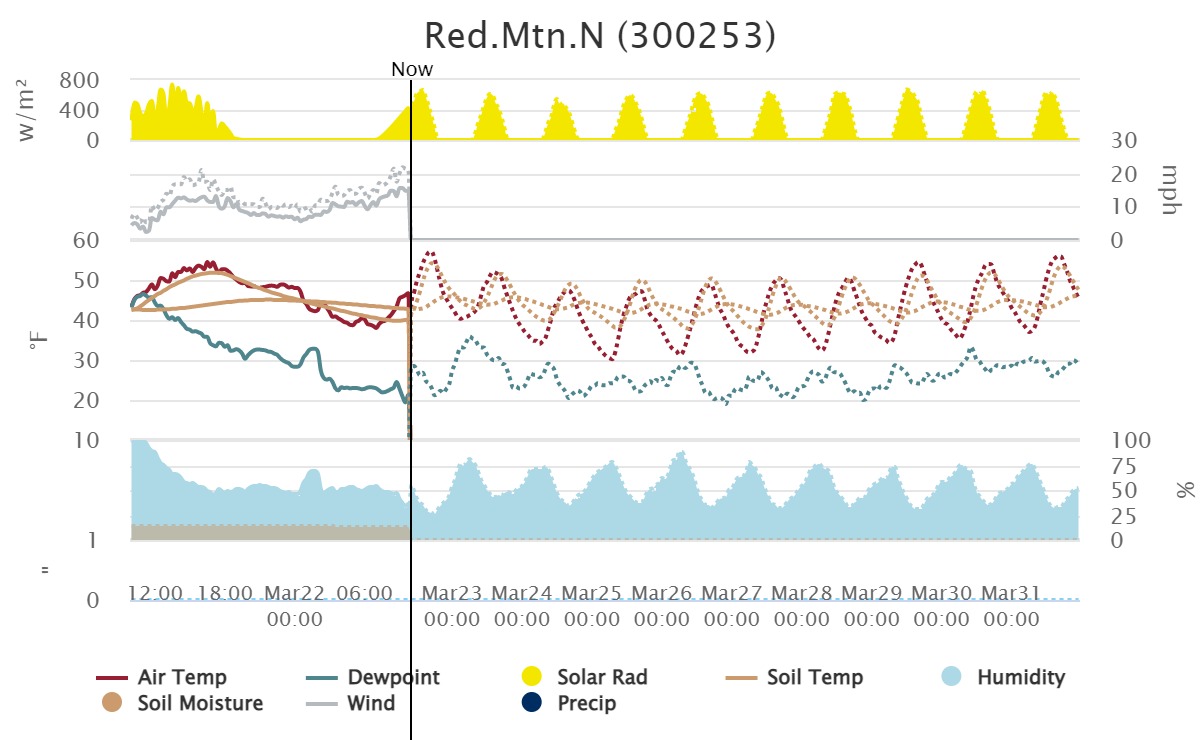
Forecasts can be accessed for a local AWN station at: https://weather.wsu.edu/?p=120850&mobile. Note that if your station does not have a forecast available it will be added when sufficient historical observations have been collected. A 10-day hourly time series of available forecast data will be shown. Hovering the cursor on a desktop or your finger on a mobile device over the forecast will show a window with precise hourly predictions of each weather variable. Real-time weather forecasts like the one shown in Fig. 2 are generated every six hours to keep the most accurate forecasts available. On average, the forecast error tends to increase over time. The average 5 ft (1.5 m) air temperature error for a one-hour forecast is around 1°F and by the end of the 10-day period averages around 5°F. A frequently updated 10-day forecast provides the best outlook for short- and long-term upcoming weather conditions.
The forecast can be used as either a direct source of information for decision making or as input into agricultural models such as growing degree day models, cold hardiness models or crop disease and pest models. AWN tier 1 tower data-based forecasts can provide valuable information for frost mitigation. The 5 ft air temperature forecasts can provide accurate insight on the anticipated overnight low temperature and when critical thresholds are met. The towers also provide 30 ft (9 m) air temperature predictions, which can be used along with 5 ft temperature predictions to determine the presence and strength of a temperature inversion.
The goal of the station-specific forecasts is to incorporate them into the various agricultural models and decision-support tools offered by AWN and other entities in the region. For example, air temperature forecasts can be combined with solar radiation forecasts and inserted into crop specific models (i.e., apple fruit surface temperature [FST]) to predict heat stress and sunburn scenarios for a week in advance.
Acknowledgements
Above work is funded in-parts by ongoing projects from WSDA- SCBG and USDA-NIFA. This article is in part re-production of our earlier publication in WSU Fruit Matters, December 2022 issue (https://treefruit.wsu.edu/article/ag-weathernet2/)
Decision Support Tools for Frost Mitigation
Authors: Basavaraj Amogi, Jake Schrader, Lav Khot and Gwen-Alyn Hoheisel, WSU Prosser IAREC
This article summarizes some of the available and emerging decision-support tools that can be used in tandem to mitigate frost effectively.
Cold Hardiness and Frost
In the fall, when temperatures day length decrease, perennial crops enter a phase called endodormancy, which allows them to acclimate to the cold. Through fall and winter, chill units are accumulated; the threshold of chill units needed to break dormancy is crop and variety-specific. At that point, the plant enters a stage called ecodormancy in which the plant becomes very responsive to environmental conditions, making spring temperature fluctuations very important as the plant deacclimates to cold. After budbreak, and when the plants have lost most of their winter hold hardiness, new season growth is very susceptible to frost damage.
Frost events can be either radiative or advective and some frost nights can be a combination of both. Radiative frost events cause the plant tissue surface temperature to decrease faster than surrounding air and are associated with clear, calm nights and temperature inversions [3, 1]. Radiative frost events can be mitigated using active methods such as (fixed or movable) wind machines, over/under tree water sprinklers, heaters, and protectant sprays. Advection is when cold air moves into the field from wind flowing greater than 5 mph. Advective frost events do not allow the formation of temperature inversion layers and are difficult to manage with available frost mitigation technologies.
For precision activation of cold mitigation techniques, tools to monitor temperature accurately during radiative frost events are needed. This is because the bud temperatures during radiative frost events can be lower than the air temperature The influence of using air vs. bud temperature for frost mitigation decisions, and devices to measure both accurately is currently being studied at WSU AgWeatherNet and Center for Precision and Automated Agricultural System.
Novel Tools to Assess Bud and Air Temperature
Bud temperatures can be measured using a variety of handheld sensing tools, including handheld wireless digital thermometers (e.g., Thermapen Blue, Thermoworks, UT) and infrared imagers (e.g., FLIR One Edge Pro, Teledyne FLIR LLC, OR) (Fig. 1). The latter is a surface measurement, and actual buds may have a slightly different internal temperature. The best way to use these handheld tools is to collect numerous readings throughout the vineyard or orchard block, which is labor-intensive.
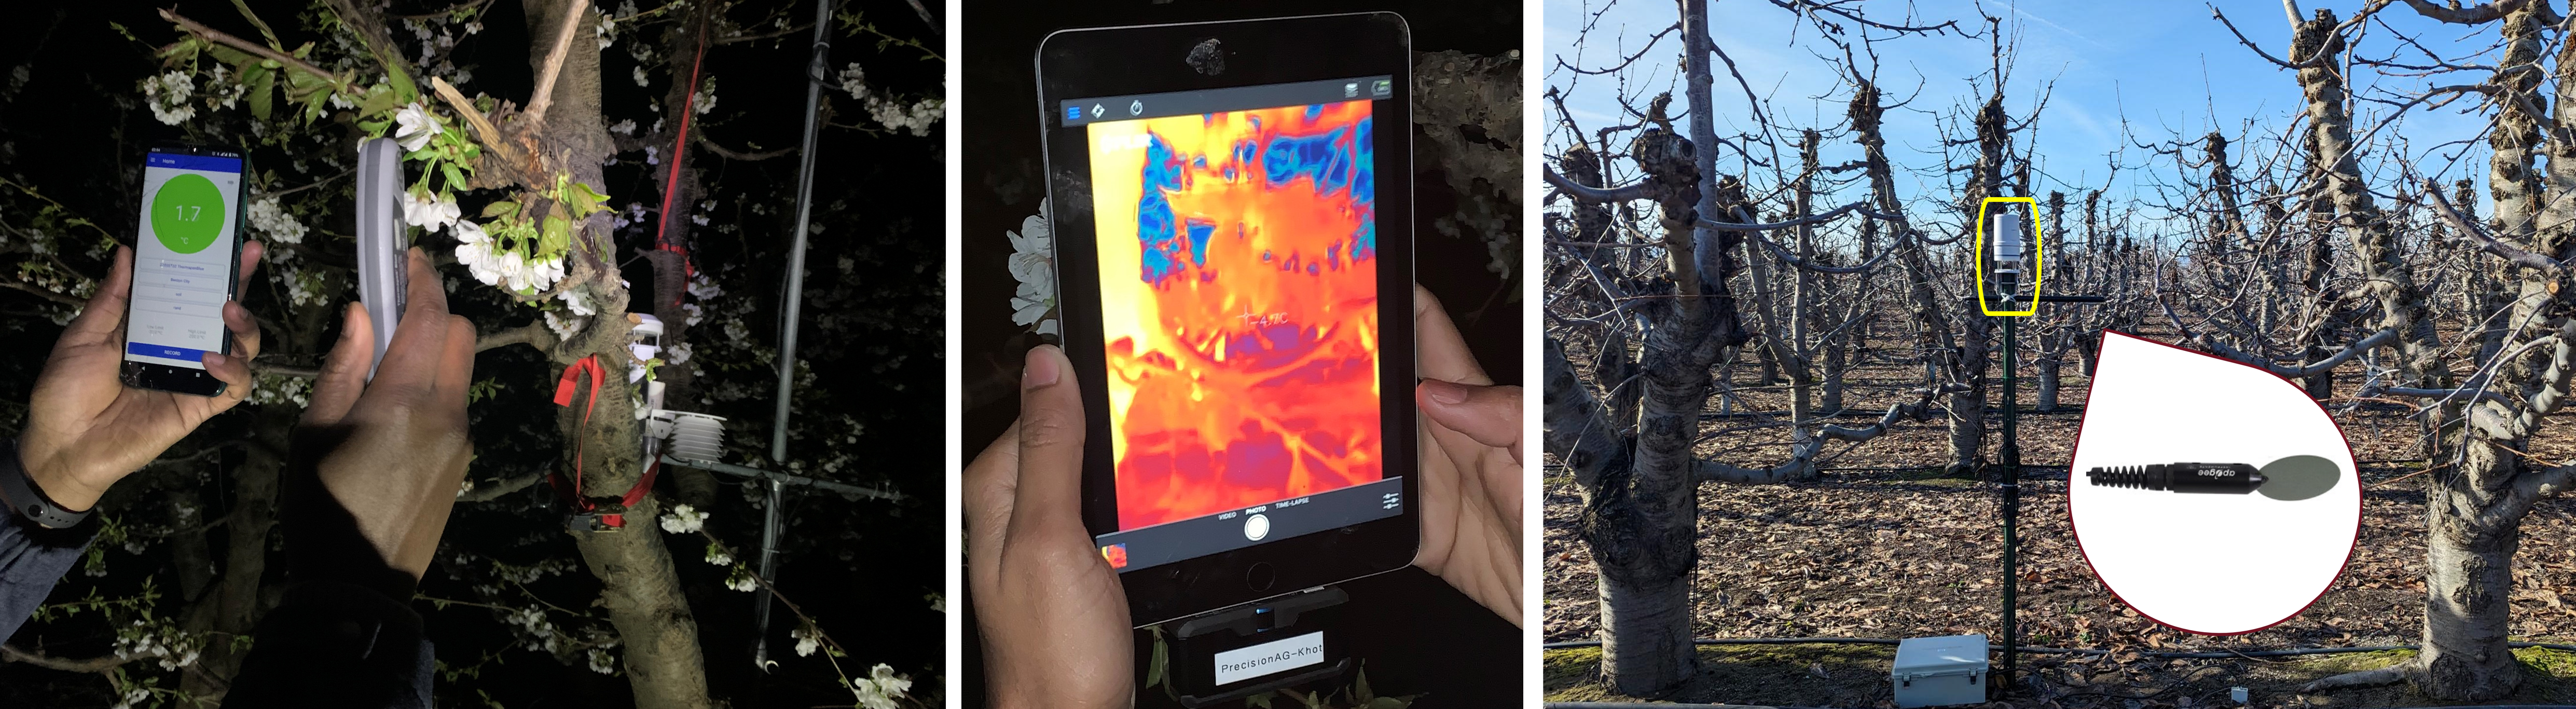
Alternatively, a sensor network could be deployed with nodes spread across the vineyard block. Each node of this network would consist of frost temperature sensors (e.g., Radiation Frost Sensor, Apogee Instruments, UT), air temperature probes, or an all-in-one weather sensor (e.g., ATMOS-41, METER Group, Inc., WA) (Fig. 1). This network can provide real-time microclimatic data for the block. Data could be visualized centrally, and an alert system can be developed to send push notifications to the block manager/farm crew.
Aerial Mapping of Inversion Strength
A wind machine’s performance is directly proportional to the temperature inversion strength, quantified as the difference between air temperature at two heights above ground level. Wind machines are effective when the inversion strength is >2°F.
Plant temperature, unfortunately, can only be raised to 50% of the inversion strength [2]. So, if the inversion strength is 2°F, the wind machine can only increase the plant temperature by a maximum of 1°F. Additional mitigation measures may be needed during specific inversion events in order to protect crops.
Typically, a standard metrological weather station (e.g., AgWeatherNet Tier 1 tower) quantifies temperature at 5 ft and 30 ft above the ground. However, wind machines are most effective when the warm air layer of the inversion is present between 15 to 75 ft above the crop.
Drones integrated with weather-sensing payloads could be used to gather temperature data at these heights. We have integrated a small unmanned aerial system (Mini 2, DJI, China, cost: $650/unit) with a low-cost (~$500/unit) weather sensing payload (iMET-XQ2, InterMet Systems, MI) as a quick inversion strength mapping tool (Fig. 2). The integrated payload measures and logs geotagged temperature (accuracy ± 0.54°F), relative humidity, and barometric pressure.
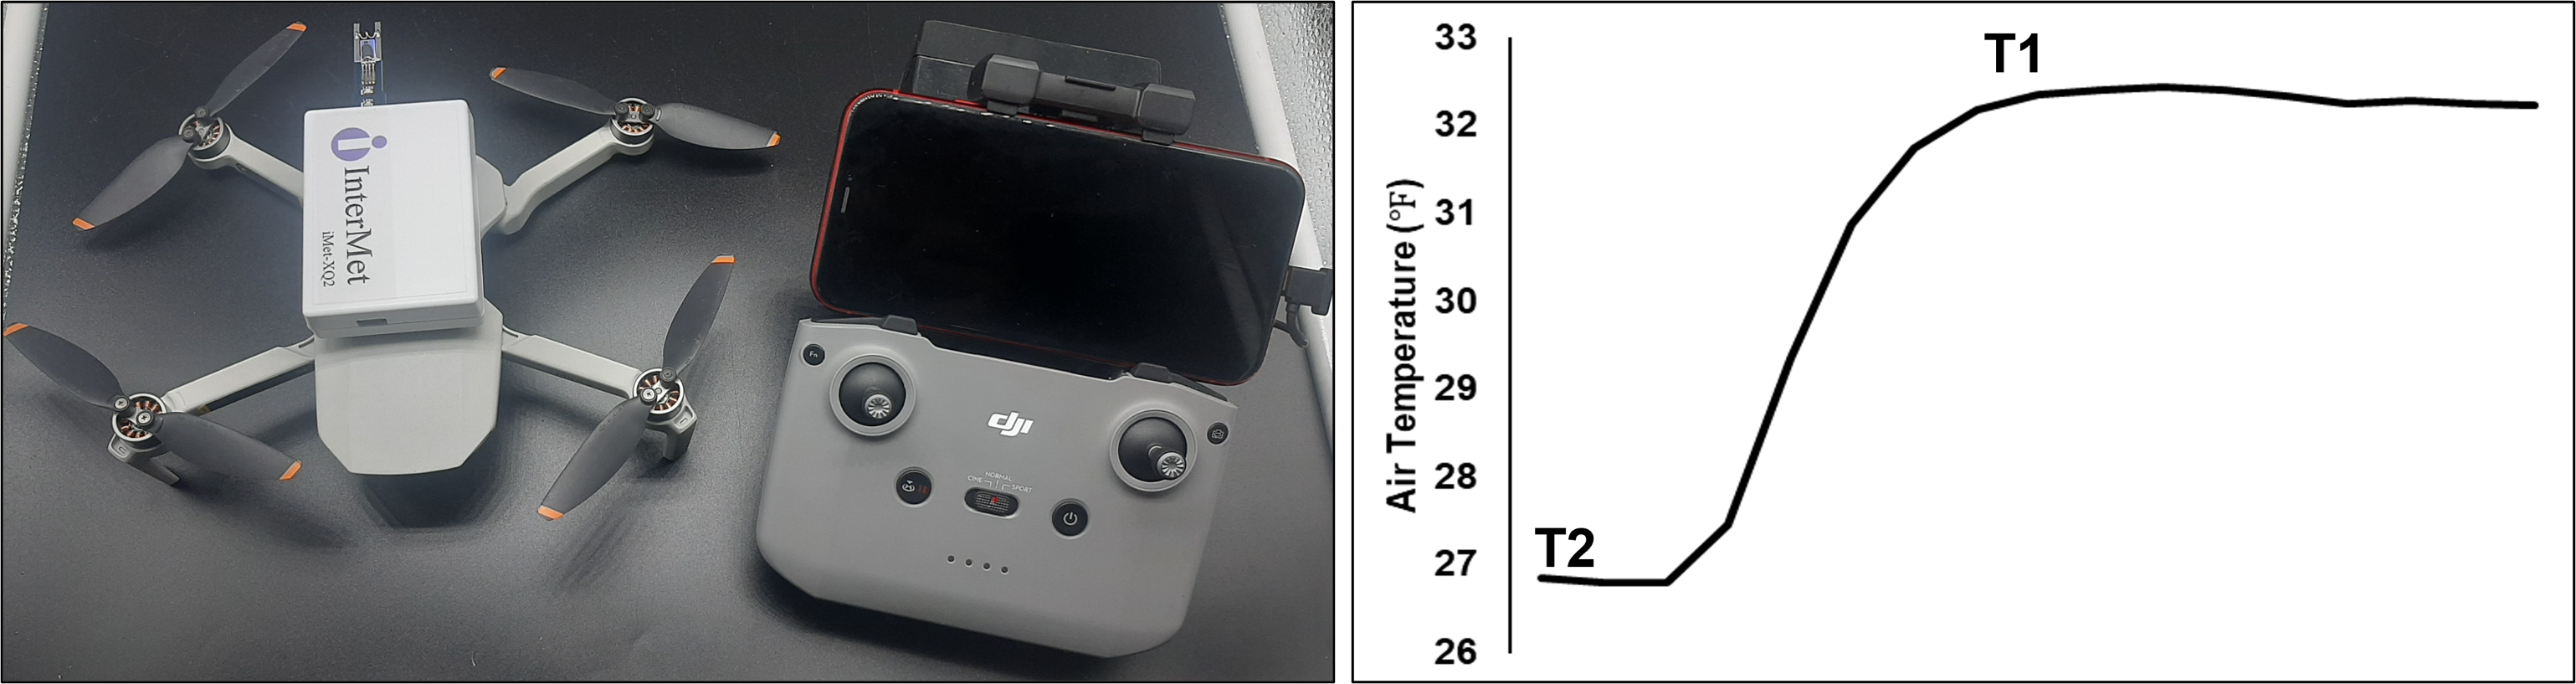
For effective inversion strength quantification and decision support, follow these steps:
- Fly drone at 5 ft above the ground and hover for 30 sec. This will collect 30 air temperature measurements at your lowest height (1 data point/sec). (Temp L).
- Fly the drone to between 15 and 75 ft above the canopy/crop zone and hover for 30 sec to log 30 air temperature measurements and your highest height (Temp H).
- Download the data for visualization (e.g., to a USB).
- Calculate “Inversion Strength = Temp H – Temp L”
If you cannot determine which height your temperature data is associated with, you can figure this out using the pressure readings from the drone sensor payload, as pressure decreases with height (e.g., lowest pressure would be associated with Temp H).
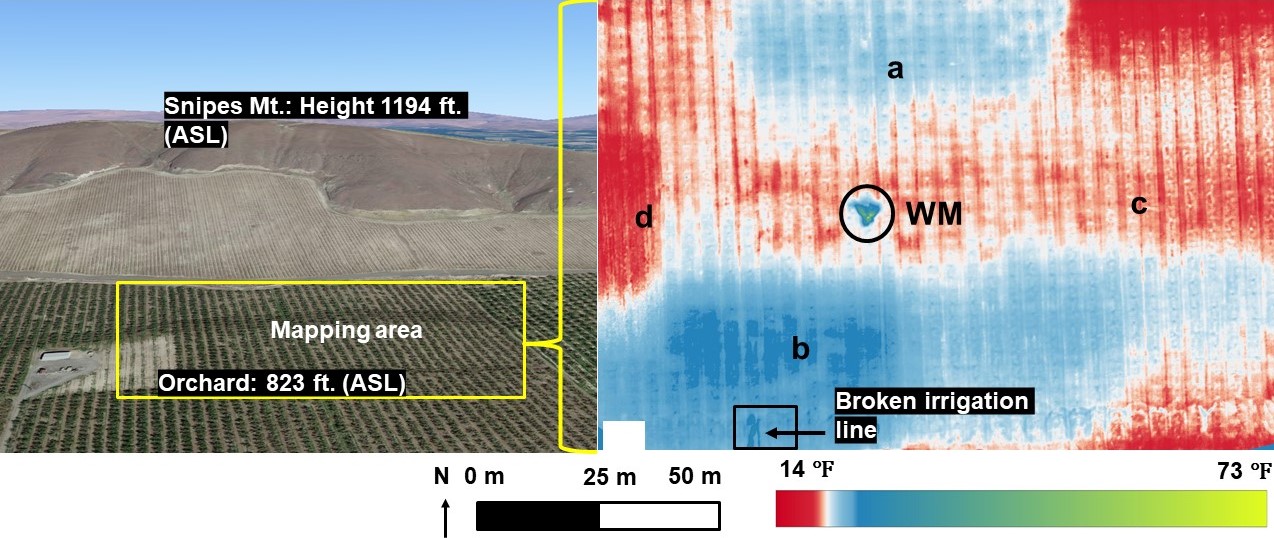
Aerial Mapping Using Thermal-infrared Imagery
Another drone-based solution would be to map vineyard surface temperature using a high-resolution radiometric thermal infrared imager (e.g., FLIR Vue Pro R). Such maps can help quantify the in-field temperature variability and lead to strategically placing heaters and sprinklers to cover areas neglected by wind machines. In Fig. 3, we mapped a sweet cherry orchard block with a 15% gradient during a frost mitigation event. The ground surface temperature map shows the temperature in different zones as: (a) the direction toward which the wind machine is blowing; (b)down the hill where under tree water sprinklers were running; (d) the area with no mitigation measures; and (c) an area where the wind machine is not mixing air, also known as the wind machine shadow zone. Aerial mapping requires special drone platforms with imaging sensor payload (~$10,000) and specialized expertise. However, this is a one-time mapping and can be done at the beginning of the season.
Acknowledgments
This article was adapted from the 1 March 2023 article posted at: https://treefruit.wsu.edu/article/frost-mitigation/
The ongoing projects are funded by USDA NIFA and WSDA SCBG. The authors would like to thank the grower collaborators Chelsea Durfey-Campbell (Lighthouse farms); Denny, Luke, and Seth Hayden (Hayden Farms); and Marcos Atilano and Keith Oliver (Olsen Brothers). We would also like to thank WSU Precision Ag lab group members Karisma Yumnam, Srikanth Gorthi, Gajanan Kothawade, and Ramesh Sahni for studying some of the decision support tools.
Additional Reading
- Campbell & Norman. 2012. An Introduction to Environmental Biophysics. Springer Publishing.
- Evans. 1999. Frost Protection in Orchards and Vineyards. USDA-ARS whitepaper.
- Kalma, et al. 1992. Advances in Bioclimatology 2.
Grape Mealybug Monitoring – 2023
Author: Michelle Moyer, WSU Prosser
One of the fundamentals to integrated pest management (IPM) is pest scouting. Anyone who has ever scouted a sessile stages (nymphs or females) of grape mealybugs (Psuedococcus maritimus) knows that “scouting” is not as simple as it sounds. Fortunately, the male grape mealybug is a much easier scouting target: pheromones attract them, and sticky tape traps them! While pheromone trapping can be an excellent tool to monitor mealybug population changes in your vineyard, trapping has not been as widely used in Washington State as it could be.
Working with colleagues out of the University of California Cooperative Extension – Napa County (Dr. Monica Cooper and team), we are launching a male mealybug trapping dashboard this summer. This dashboard will be similar to the Fungicide Resistance dashboard with FRAME, and insect monitoring dashboards available in Napa, CA. We anticipate posting male mealybug trap counts on a weekly to biweekly basis from around Washington state from late May through the summer. While the trap data will be generalized to a county or AVA, the information will be publicly available.
That’s where you come in – in order to get data on male mealybug flight patterns, we need people to trap and count them! If you are interested in participating in this dashboard development, please contact Michelle Moyer (michelle.moyer@wsu.edu) for more information. It will require participants to purchase and place male grape mealybug pheromone traps in their vineyard, and conduct weekly to every-other-week counts from mid-May through July (or September, depending on your interest), as well as regular trap maintenance.
You don’t have to participate in this project to monitor mealybugs. Below is a quick overview of how to used pheromone traps for mealybug monitoring:
Step 1: Get the Gear
Three components are needed for male grape mealybug trapping:
- Delta Trap: This is the classic triangle-shaped trap that will hold the pheromone lures and sticky cards. They come in both single-use (with a built-in sticky liner) or reusable (with replaceable sticky cards). Delta traps come in a range of sizes; size isn’t too important, but the bigger the Delta trap, the more likely additional debris may enter the trap and get stuck on the sticky cards.
- Pheromone Lure: This is the “chemical” component that attracts the insect. Mealybug pheromone lures are SPECIES-SPECIFIC, so make sure you are buying the lure for GRAPE MEALYBUG. Using lures for other mealybugs such as vine mealybug will not work for attracting grape mealybug. Lures need to be refreshed regularly in-season (see the packaging for details), and should be stored in the freezer if not being used.
- Sticky Card: As the name suggests, this what traps the male mealybug inside the Delta trap, when it flies inside in search of the source of the pheromone. In reusable Delta traps, these are replaced weekly to every-other-week. While sticky cards can come in an assortment of colors, white or yellow is the easiest to use.
Step 2: Set up The Gear
Grape mealybug flight patterns in WA are likely consistent between sites within a growing season. As such, you a trap density higher than 1 trap per 30 acres, and for general monitoring, you likely don’t need more than 1 trap per farm. As such, it is more valuable to keep up with monitoring and counting a single trap, then to have multiple traps that get neglected.
Set the trap up within a vineyard block where you have had routine mealybug challenges in the past. Placing it at fruit-zone height is ideal. While it is best to place the trap within the vineyard, if you have concerns about machine damage or pesticide over-spray, the trap can also be placed just outside of the vineyard block for easy access.
Step 3: Collect Your Data
Remove and count the male mealybugs on sticky cards weekly to biweekly. The are small, so using a microscope, hand lens, or magnifying glass can be helpful. Male grape mealybugs are small and reddish in hue.
Step 4: Use Your New Info!
Male mealybugs are out when females are ready to mate. That means when your trap counts peak, and then start to decline, you will likely see eggs hatch and nymphs emerge a few weeks later. This information can help you better time your management strategies, such as when to apply a systemic insecticide, so that the product is in the plant by the time nymphs are out and feeding.
Ask your agronomist, local ag supply store, or WSU Viticulture Extension for information on where to order grape mealybug trapping components.
Engaging in V&E Research
Author: Melissa Hansen, Research Program Director, Washington State Wine Commission
The Washington wine research program is one of just a few in the country that provides the industry opportunity to guide its direction. Also a rarity, it makes research results easily accessible to all wine grape growers and wineries in the state, regardless of size.
Around 20% of the Washington State Wine Commission’s (WSWC) budget is dedicated to supporting viticulture and enology research. Of the assessments paid by growers and wineries to the WSWC, $2 from each assessed ton of grapes and 2 cents from each assessed gallon of wine sold supports the industry’s research program. The industry is invested and involved in research. The WSWC provides multiple ways for growers and wineries to give input, including industry surveys, and inviting everyone to come listen to research proposals and reports.
But first, how does V&E research happen in Washington? Since the early 1980’s, the Washington wine industry has been in the driver’s seat when it comes to research. In 1981, state legislation was enacted to send ¼ cent per liter from taxes collected on all wine sales in the state to Washington State University for viticulture and enology research. The legislation included creation of an industry advisory committee to recommend research funding.
This committee, now called the Wine Research Advisory Committee (WRAC), is a subcommittee of the WSWC. It serves as the industry’s scientific review arm and makes research funding recommendations for approval by the WSWC Board of Commissioners.
V&E research in Washington is primarily funded through two competitive grant programs. The Washington State Grape and Wine Research Program, administered by WSU, is funded by the State liter tax, WSU, Auction of Washington Wines, and the WSWC. Additionally, the WSWC has a separate competitive grant program to support research outside WSU.
First Step: Learn
New to the Washington wine industry? Here’s a short list of resources to help you get started in learning about V&E research:
- Sign up for Dr. Michelle Moyer’s This Week in Viticulture email list. The weekly V&E Extension emails will inform you of upcoming events, resources, and more. Subscribe at https://irrigatedag.wsu.edu.
- Read the WAVE Research Report, a digital newsletter focused on research—news, articles, events, key findings and people—that’s published every other month by the Washington Wine Commission. (WAVE = Washington Advancements in Viticulture and Enology.) To get on the list, send an email to mhansen@washingtonwine.org.
- Visit the Research & Innovation webpages of the Washington Wine Commission’s website (www.washingtonwine.org/research-innovation/). Browse through the Research Library to read archived research reports, research articles, webinar recordings and more. View the history and funding to learn the history of the industry’s research partnership with WSU and information about industry research committees.
Next Step: Participate
Take your research learning to the next level through active participation in annual research surveys and events, such as WAVE research seminars and WAVEx webinars and the annual Research Review to learn about recent and ongoing research.
- Research Survey – The annual Research Survey collects industry input on research priorities. WRAC uses survey feedback to set annual research priorities. Research priorities are used by scientists and help ensure proposals are relevant to the needs of Washington grape growers and winemakers.
- Research Review – Held in February, the two-day meeting is a front row seat to research. The Review is a forum for scientists to present new research proposals and share progress of continuing projects to WRAC. Industry members are invited to participate and rank the importance of each proposal. Rankings are then used by WRAC when it makes research funding recommendations.
- WAVE and WAVEx – WAVE research seminars are in-person events designed to share research findings and bring industry together with scientists. WAVEx webinars are the condensed version of WAVE and focus on a single research topic. WAVE and WAVEx events are co-sponsored by Washington State University and Washington Wine Commission.
Final Step: Volunteer
If you’re science-minded and interested in the details of research, consider joining WRAC.
Committee members are appointed for three-year terms by the WSWC board. Duties of WRAC include setting annual research priorities, reviewing proposals and recommending research funding and supporting research activities. Time requirements include mandatory attendance at the two-day Research Review, annual meeting in June and additional remote meetings.
The WSWC seeks broad representation for WRAC membership. Currently, WRAC has 12 members. The membership roster is posted at www.washingtonwine.org/get-involved/. Preferred membership qualifications include a minimum of Bachelor of Science degree in viticulture, enology or related field; minimum of five-years of experience in the wine industry; analytical thinker and highly interested in research; and resident of Washington. In filling vacancies, candidates should submit applications to the WRAC Chair for review by WRAC. Before forwarding a nomination to the WSWC board for appointment, two-thirds of WRAC must agree on the nomination.
WRAC is always looking to identify stakeholders interested in volunteering for future WRAC membership. A list of prospective members is maintained for future consideration when there are membership vacancies on the Committee. If you are interested in serving on WRAC in the future or have any questions about the industry’s research program, please contact Melissa Hansen at mhansen@washingtonwine.org.

Upcoming WAVE and WAVEx
Don’t miss the next WAVEx webinar on April 20 titled “To Fumigate or Not?”. Dr. Michelle Moyer will share results and findings from industry-supported nematode management and rootstock research.
The free webinar will be held from 12:30-1:30 pm and one pesticide certification credit has been requested from WSDA and ODA. Preregistration is required.
And mark your calendar for August 10 when WAVE combines with the Washington State Grape Society’s and WSU’s annual Grape Field Day. Stay tuned for more details!
Register for the WAVEx webinar at: https://washingtonwine.org/wave/
