
This issue of VEEN was originally published as a .PDF in September 2023, and posted online. That issue is now archived, but accessible on the VEEN Archive webpage.
VEEN is curated by WSU Viticulture Extension. For questions on articles, or to request to submit an article in future issues, reach out to Michelle Moyer.
A Note from the Editor
The spring that never seemed to start (being almost 2 to 3 weeks behind long-term average), turned into the summer that progressed at a rapid pace! In our own research blocks here at WSU Prosser IAREC, we saw budbreak to bloom occur in about 1 month, taking us from a behind-schedule season, to one that was ahead of long-term average.
The heat we experienced in August seemed to slow things down, but now with our warm mid-September, the pace has picked up again. So while we know many of you will see very little rest in the next 6 weeks, we hope you have some time to take a glance through this issue of VEEN… or, that the very least, bookmark it for the winter!
This issue of VEEN is a great mix of articles — much like your favorite Halloween candy grab-bag. From new regulations regarding pesticide applications to vineyard nutrient budgeting, from irrigation management to online resources, there is always something new to learn. These will all be important topics to follow as we head into the winter planning season — whether you are building out next year’s spray programs, planning your nutrient applications, or trying to better design irrigation regimes.
I wish everyone a safe and productive harvest season, and look forward to connecting this winter during our various industry meetings.
Michelle M. Moyer
Viticulture Extension Specialist
Professor of Viticulture
WSU Prosser IAREC
Table of Contents
Endangered Species Act and Impact on Pesticide Applications
Authors: Rachel Bomberger, Christina Ward, Henry Wetzel, and Wendy Sue Wheeler, WSU Pesticide Education
Have you recently purchased a new container of your favorite pesticide product? Did you read the entire label prior to application, specifically the section titled: “Directions for Use”? If not, you could be missing critical use information.
What New Information Do I Need to Be Aware Of?
Coming soon to labels near you will be new Endangered Species Protection Requirements use directions. These new use directions are being implemented in order to protect and preserve certain endangered and threatened species. Under the Endangered Species Act (ESA) it is a federal offense to take (kill) or otherwise harm these species. We do not know when all products will have the new label language, but you should expect to see it soon.
For applicators to comply with the ESA, the “Directions for Use” section on pesticide labels will direct users to the Endangered Species Protection Bulletins, commonly referred to as Bulletins. These Bulletins contain directions for use specific to the area in which the product will be applied. As an applicator, you will need to obtain a Bulletin prior to using the pesticide, but no earlier than six months prior to the application.
What Are Endangered Species Protection Bulletins?
Bulletins enable pesticide users to find any ESA restrictions or limitations for the specific area where the pesticides will be used. When crop land overlaps with federally listed endangered or threatened species or their habitat this area is designated as a Pesticide Use Limitation Area (PULA). This is an evaluation of the potential for exposure such as drift, runoff, leaching or if a spill were to happen during offsite transport.
PULA’s may have additional mitigation measures added to the product label use restrictions depending on the active ingredient, product formulation, and time of year. The restrictions could be increased buffers; environmental conditions (i.e., soil saturation) and weather conditions you may not apply the product during; or other use restrictions.
The Environmental Protection Agency (EPA) has designed a web-based tool intended to make the Bulletins accessible to pesticide users. Bulletins are extensions of the pesticide label and are enforceable requirements from EPA and state lead agencies, like Washington State Department of Agriculture (WSDA). If you misuse the pesticide and it results in the ‘take’ (kill or harm) of a federally listed species the action is enforceable as a label violation under the Federal Insecticide, Fungicide, and Rodenticide Act (FIFRA) as well as enforceable under the Endangered Species Act by the United States Fish and Wildlife Service (USFWS) and/or National Marine and Fisheries Service (NMFS).
The Bulletins are location dependent meaning only certain sections of a field or block may be impacted by a PULA. Data for the PULAs come from the United States Fish and Wildlife and National Marine Fisheries Service for the endangered and threatened species, and USDA and other sources for cropping information.
Remember: Bulletins are intended to identify and give options to mitigate potential risks from a pesticide’s registered uses to species (or taxa) of concern in the area. As of this article, the species and habitat of concern are salmonids in the Pacific Northwest. More federally listed endangered and threatened species may be added in the future.
When Do I Need a Bulletin?
You will need to obtain a Bulletin when your product label directs you to visit the EPA Bulletins Live! Two website. Most often the ESA statement is under the Use Directions – but can vary label to label. It is the label on the product that you are using that will determine whether you need to obtain a Bulletin. You must provide evidence that you obtained a Bulletin, regardless of whether your application was in a PULA or not, if requested during a compliance inspection or investigation.
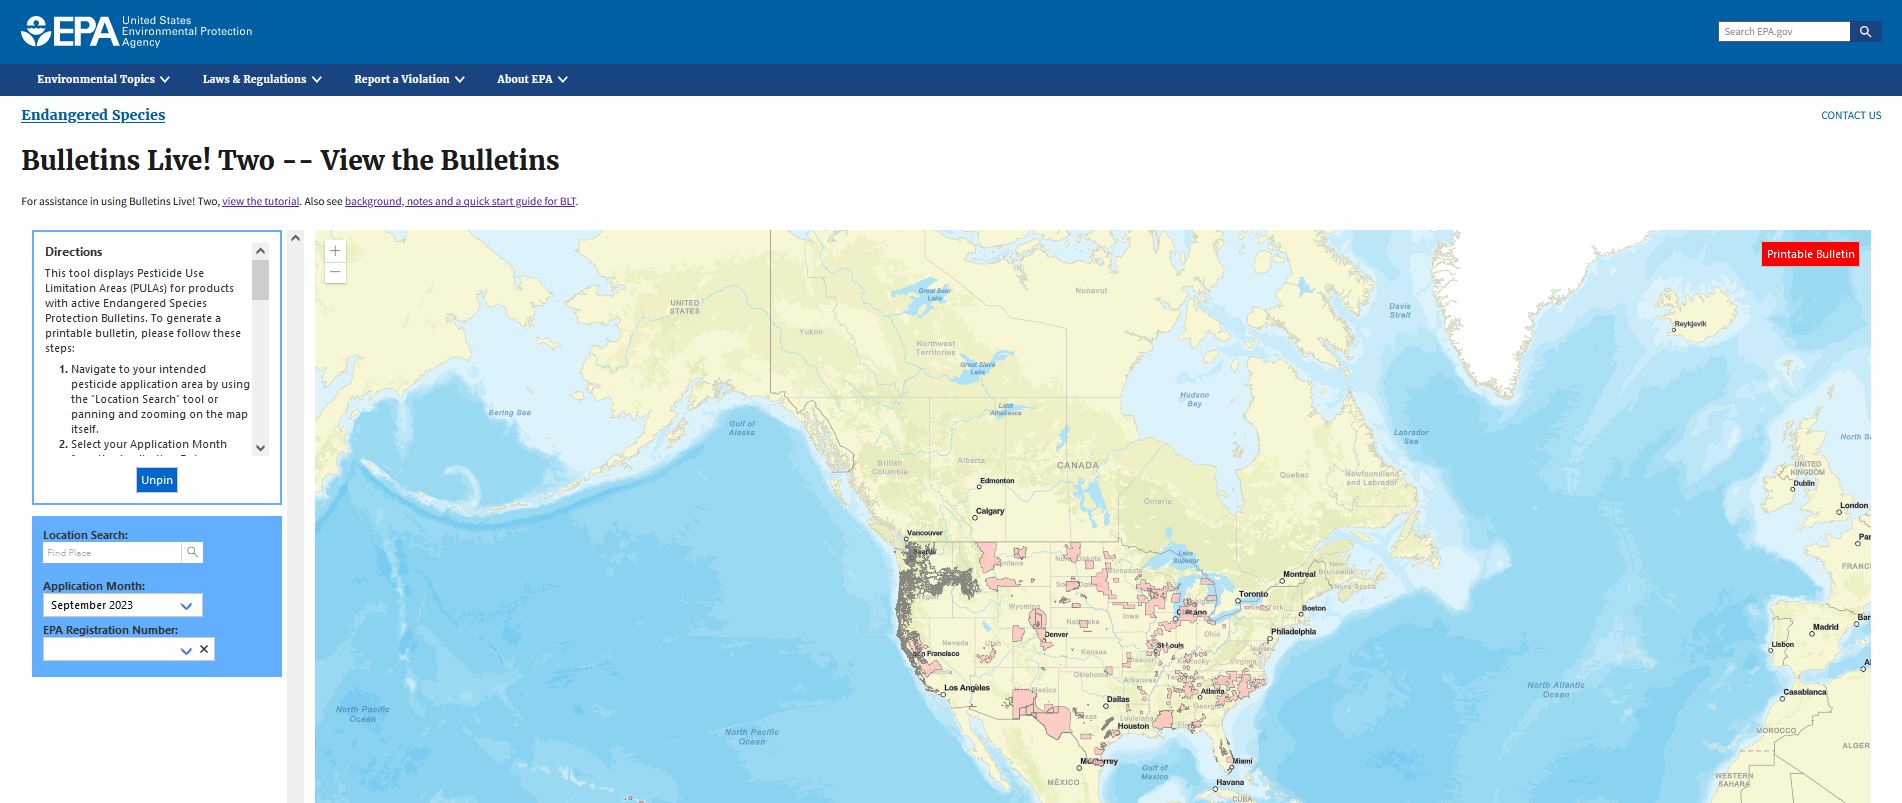
If your pesticide application is within a PULA, you will need to read and follow the limitations for the product. If you are outside of a PULA, you will need to document that there are no limitations within your application area during the month of application. PULAs are shown on the map on the Bulletins Live! Two database with pink-orange highlight. When you zoom into the map you can see specifically where parts of fields may be in a PULA.
How Do I Access an Endangered Species Protection Bulletin?
To access a Bulletin specific to your needs, you will need to visit the website: United States Environmental Protection Agency’s Bulletins Live! Two, follow the web address on the product label, or click on the link below:
https://www.epa.gov/endangered-species/Bulletins-live-two-view-Bulletins
Tips For Navigating the Website
A tutorial is available on the website on how to search for and obtain your Bulletin. The website is not easily accessible on your mobile device and is not consistently user-friendly.
Washington State Department of Agriculture and WSU Pesticide Resources and Education Program have some suggestions on how to best utilize the website:
First, type in the EPA registration number which can be found on the front page of the label. Be sure to use the registration number, which only contains digits, rather than the EPA establishment number.
Next, enter the month you anticipate applying the product. One suggestion is to download the Bulletin for the months you think you may use the pesticide. For instance, if you typically do a post-emergent herbicide application in March and sometimes April, you should download both month’s Bulletins in preparation. As a reminder, you must obtain the Bulletin PRIOR to using the pesticide but no earlier than six months before the application.
Finally, you will need to zoom into or enter the location of your application. It is often easier to ‘toggle’ to the geographic map to see the actual landscape to better find the precise area of your application.
You will know when your information has been entered successfully when the rectangle in the upper right corner, “Printable Bulletin,” turns from red to green. By clicking on the green rectangle, you can download and save a PDF of your Bulletin. The PDF will indicate whether there are use limitations if the application is in a PULA or show that there are no use limitations.
Keep in mind that you will need to document both a Bulletin with PULA restrictions as well as Bulletins with no PULA.
Final Thoughts
This new system will take some time to adjust to. WSDA and WSU are ready to assist as best we can to help applicators comply.
A link to the Bulletin webpage can be found on WSU Pesticide Information Center OnLine (PICOL): https://picol.cahnrs.wsu.edu/.
If you have compliance questions, contact: Washington State Department of Agriculture (WSDA) pcompliance@agr.wa.gov (360) 902-2040.
If you have general questions, you can also contact WSU Pesticide Resources and Education at pest@wsu.edu.
![]()
Optimizing Grapevine Nutrient Budgeting for Long-Term Success
Authors: Nataliya Shcherbatyuk, Pierre Davadant, and Markus Keller, WSU Prosser
requires proper management of vineyard nutrition. Grapevines require a balanced supply of macro- and micronutrients for optimal growth, fruit development, and overall vine health. Different nutrients play specific roles in various physiological processes, and when nutrients are not adequately replaced, the resulting imbalances and deficiencies can compromise vine health, yield, and grape quality.
An essential aspect of vineyard nutrient budgets is considering both the inputs and outputs of nutrients within the vineyard. Nutrient inputs can be explained mostly by fertilizer application (both organic and inorganic), fixation by leguminous cover crops, and deposition by rainfall. Nutrient outputs refer to the loss of nutrients through harvest and leaf fall, in addition to leaching and denitrification.
By estimating nutrient inputs and accounting for key nutrient losses, vineyard managers can assess the balance of nutrient supply and determine if adjustments to the nutrient management practices are necessary.
During grape harvest we remove nutrients with the harvested fruit. If these nutrients are not replenished, deficiencies can develop over time. Therefore, accounting for nutrient removal during harvest is the first step towards maintaining a nutrient balance in the vineyard.
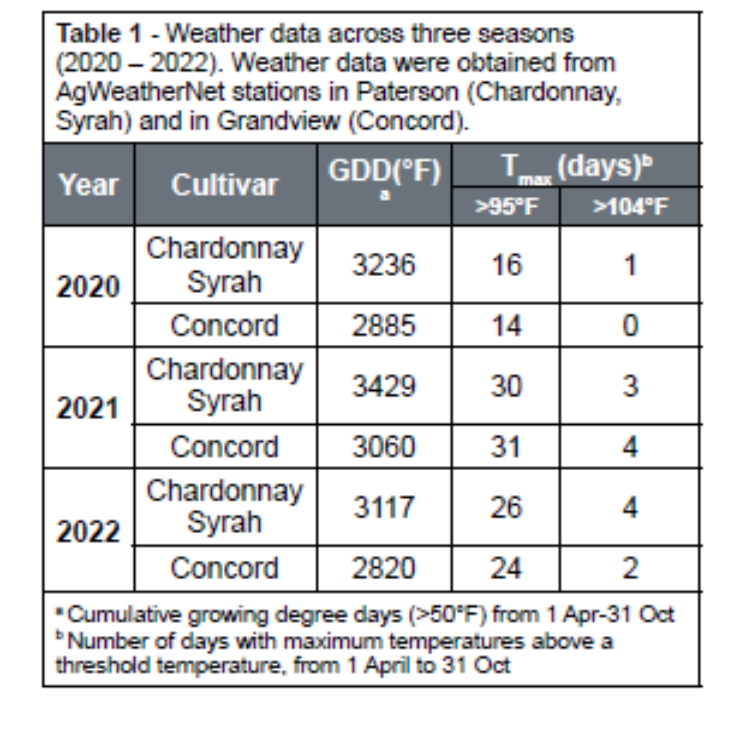
Over three years (2020-2022), we analyzed nutrient levels of harvested fruit from three different cultivars: Chardonnay, Syrah, and Concord. The Syrah and Chardonnay vineyards, which are located in Paterson, WA, received on average an additional 339°F of seasonal growing degree days (GDD) compared to the Concord vineyard located in Sunnyside, WA (Table 1).
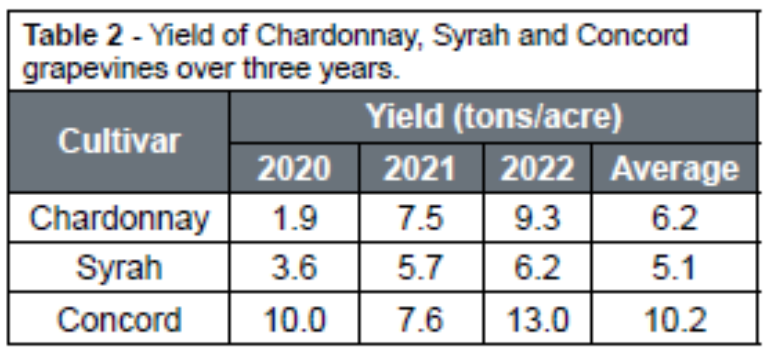
For each cultivar, the yield varied among years, with the highest yields in 2022. On average across the three years, the yield for Syrah, Chardonnay and Concord was 5.1 tons/acre, 6.2 tons/acre, and 10 tons/acre, respectively (Table 2).
On average across the three cultivars and three years, fruit harvest removed about 2.9 lb of nitrogen (N), 0.7 lb of phosphorus (P), 6.5 lb of potassium (K) and 0.4 lb of magnesium (Mg) with each ton of fruit (Table 3).
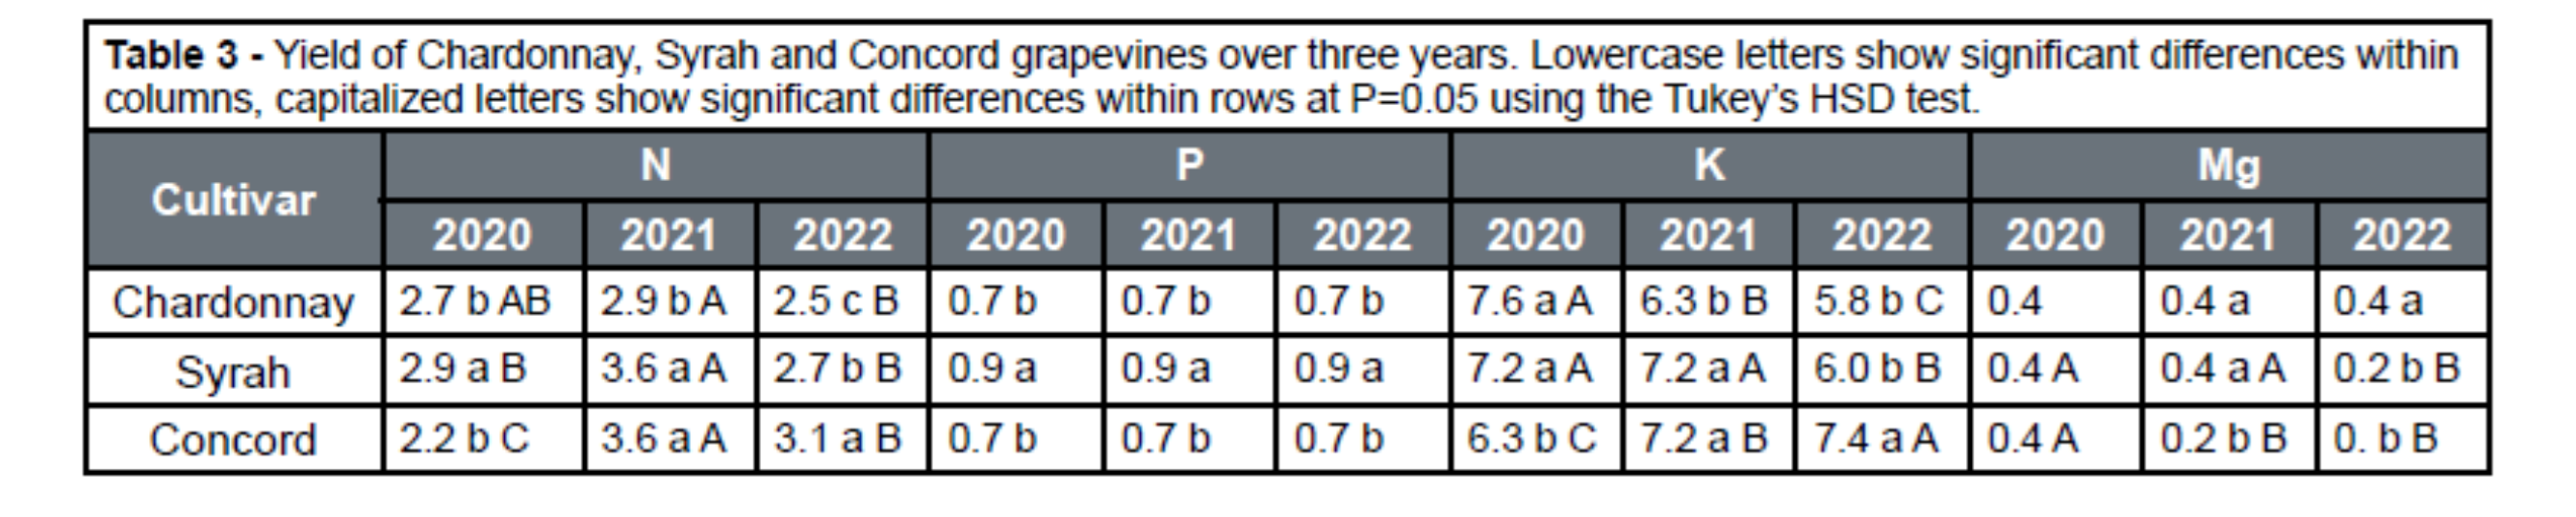
The wine grapes contained the lowest amount of N in 2022 and the highest amount in 2021, while the least N in juice grapes was recorded in 2020. The juice grapes also contained more N and K than the wine grapes in 2022, while in 2020 N and K were lower in juice grapes compared to wine grapes. While P removal was consistent across the years, more P was generally removed from the Syrah vineyard compared to Chardonnay and Concord. The fruit Mg concentration was the same for all three cultivars during 2020 and did not change for Chardonnay throughout the years; however, Mg was slightly lower in Concord grapes in 2021 and 2022, and in Syrah during 2022.
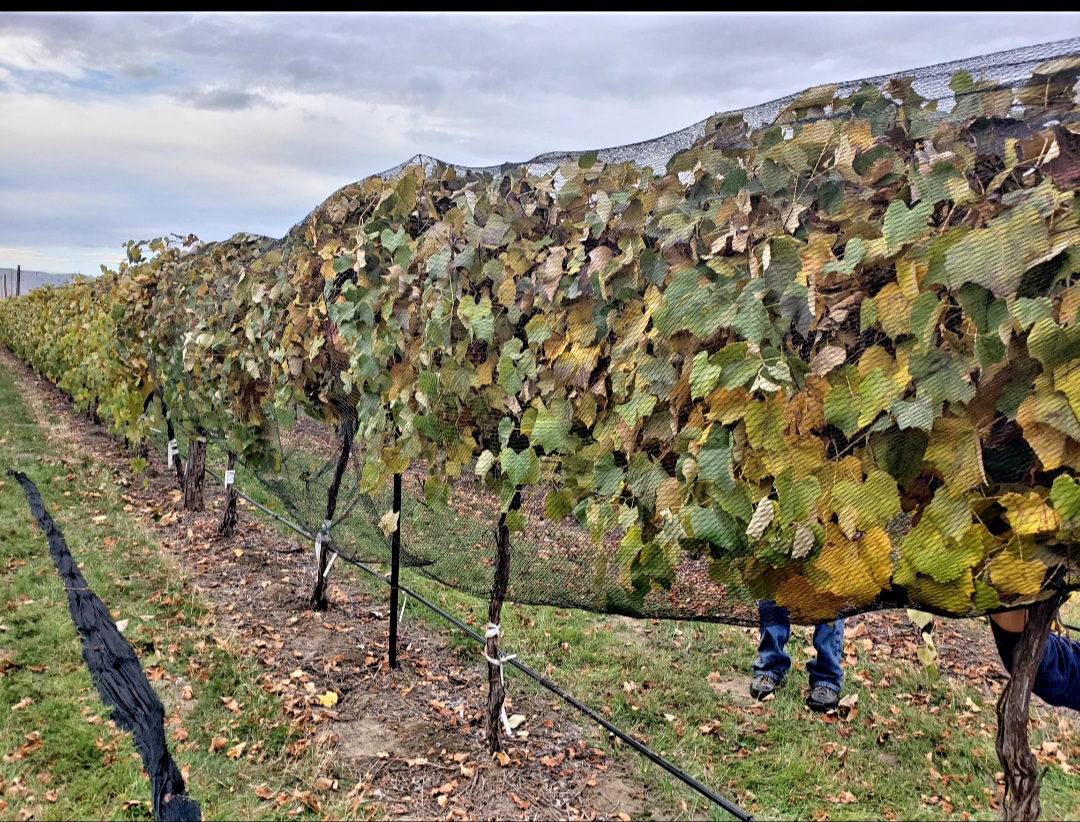
Leaf senescence (Fig. 1), the annual process of aging and leaf fall in plants, plays a crucial role in the life cycle of grapevines. During senescence, foliar nutrients undergo various transformations and redistributions within grapevines.
Essential nutrients, such as N, P, K, and micronutrients, are remobilized from senescing leaves and transported to other parts of the vine for storage. This redistribution ensures the efficient utilization of nutrients and supports the growth and development of fruits, storage organs, and new vegetative growth in spring.
This raises two questions: How much nutrient can be lost during leaf fall; and what happens if leaves are killed by frost before the remobilization process is complete?
To answer these questions, we measured the nutrient content of senescent leaves from the same vineyards blocks through 2020 – 2022. We enclosed vines with bird nets after harvest and collected leaves following the first frost. Then we analyzed the nutrients that remained in the dead leaves.
There were large differences in end-of-season leaf nutrients among growing seasons and cultivars (Table 4). The N, P and K amounts in juice grape leaves per acre were much higher than those in wine grapes, while Mg in Concord was similar to that in Chardonnay and double that in Syrah.
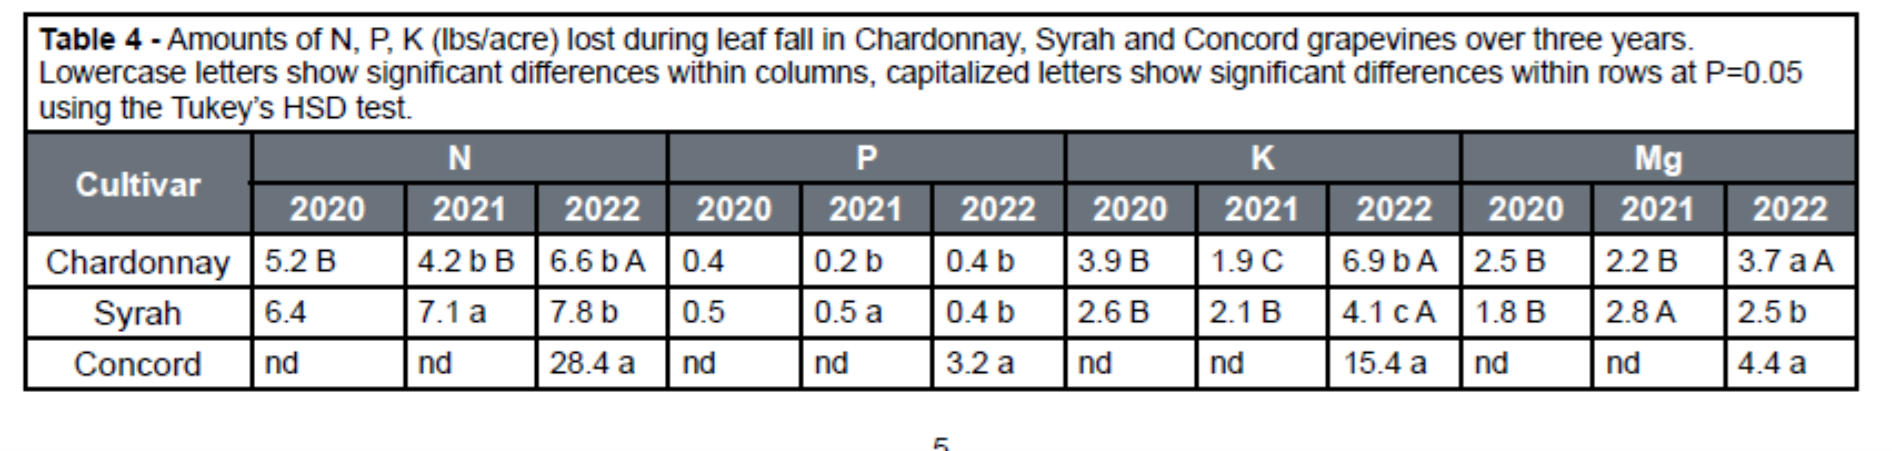
Juice grapes typically have much larger canopies than wine grapes, so they potentially lose more nutrients during leaf fall. With the exception of P, nutrient losses via leaves in wine grapes seem to be higher in late growing seasons when leaves are green until they are killed by the first frost (as was the case in 2022). Foliar K was especially responsive to seasonal differences, being much lower after the long 2021 fall and higher in 2022 when frost killed green leaves.
First killing frosts (<28.4°F) occurred on 23 October 2020, 9 December 2021, and 10 November 2022. When a fall frost kills leaves before their nutrients have been recycled back to the vines, then those vines have lower stored nutrients available to support budbreak in the following spring. Such seasonal differences should be taken into account when developing vineyard nutrient budgets for fertilizer recommendations.
Clearly, leaf fall in addition to fruit harvest contributes to nutrient removal from a vineyard. If senescent leaves stay in the vineyard, their nutrients can be gradually incorporated by soil microorganisms back into the soil. However, if wind blows those leaves away, significant amounts of nutrients can be lost.
Considering nutrient loss with grape harvest and leaf fall when creating a fertilizer program is essential for maintaining vineyard nutrient balance, sustaining vine productivity, and supporting the long-term health and quality of grapevines. By replenishing the lost nutrients, growers can ensure that the vines have an adequate nutrient supply for optimal growth, development, and fruit production. This is especially important in dry regions where soils have low organic matter and vine growth and productivity rely on irrigation.
Soil Water Sensors: Monitoring Water Use and Irrigation Scheduling
Author: Pete W. Jacoby, WSU Pullman
he agriculture water use efficiency world, in the fact that grapevines are generally quite efficient users of water. Winegrowers also typically reduce the amount of water used to produce wine grapes through the application of regulated deficit irrigation (RDI), which involves applying less water than the vine expends through crop evapotranspiration (ETc).
Through RDI, water applications may be reduced to deliver between 70-80% of the water lost through ETc. A moderate amount of vine water stress derived from RDI can enhance wine grape quality for producing premium quality wines.
Another means of water conservation is use of subsurface irrigation. Unfortunately, buried driplines can be negatively impacted by soil clogging or chewing damage from burrowing rodents.
A relatively new irrigation method called Direct Root Zone (DRZ), uses vertical plastic tubes to deliver drip irrigation at a 2-ft. soil depth near the base of the vine. DRZ has been shown to save as much as 25-35% of the water applied through surface drip (SD) irrigation without significant yield loss. Releasing water into the lower rooting zone expands the availability of water throughout the soil profile, and creates an upper dry zone that reduces water loss to evaporation and weed competition.
The research described here is focused on determining if using soil water sensors to schedule DRZ irrigation can increase crop water use productivity under RDI.
Description of the Study
The primary study presented here uses SENTEK electronic capacitance probes (Drill and Drop) paired with METER GROUP Soil Water Tensiometers (TEROS 21 Gen.II). The SYNTEK probes contain sensors spaced every 4 in to 2-3 ft depths, while the TEROS 21 sensors were installed at 3 depths to 24-26 inches and in close proximity to the probes.
Water at this location is scheduled by the grower using guidelines developed over four decades. Irrigation amount is controlled by battery powered controllers to apply a specific water volume that is delivered by SD and DRZ delivered to replicated plots of 30 vines, each being irrigated at a 60% RDI.
Studies have been on-going at this site to assess soil water retention and use under 4 rates of irrigation and irrigation delivery by both SD and DRZ drip application. SYNTEK EnviroScan soil moisture probes have been used to record soil moisture dynamics to depths of 7 ft. Research into vine root responses indicated that DRZ delivery led to deeper root system development than under SD irrigation delivery.
Studies were also conducted on soil water sensor placement of sentinel sensors to activate automated irrigation scheduling. Current research has added arrays of 2-ft. probes with sensors spaced at 4-in. intervals down to a 2-ft. depth. Soil water tensiometers are paired with these probes.
Soil Water Content and Tensiometer Data
Figure 1 illustrates the variation in soil water content during 3 irrigations events during early August 2023. An irrigation rate approximating a 60% RDI was applied by SD (top), and DRZ (bottom) at a 2-ft. depth. Water is dispersed within the soil profile in all directions via soil capillary action, and root system absorption and transmission via hydraulic redistribution.
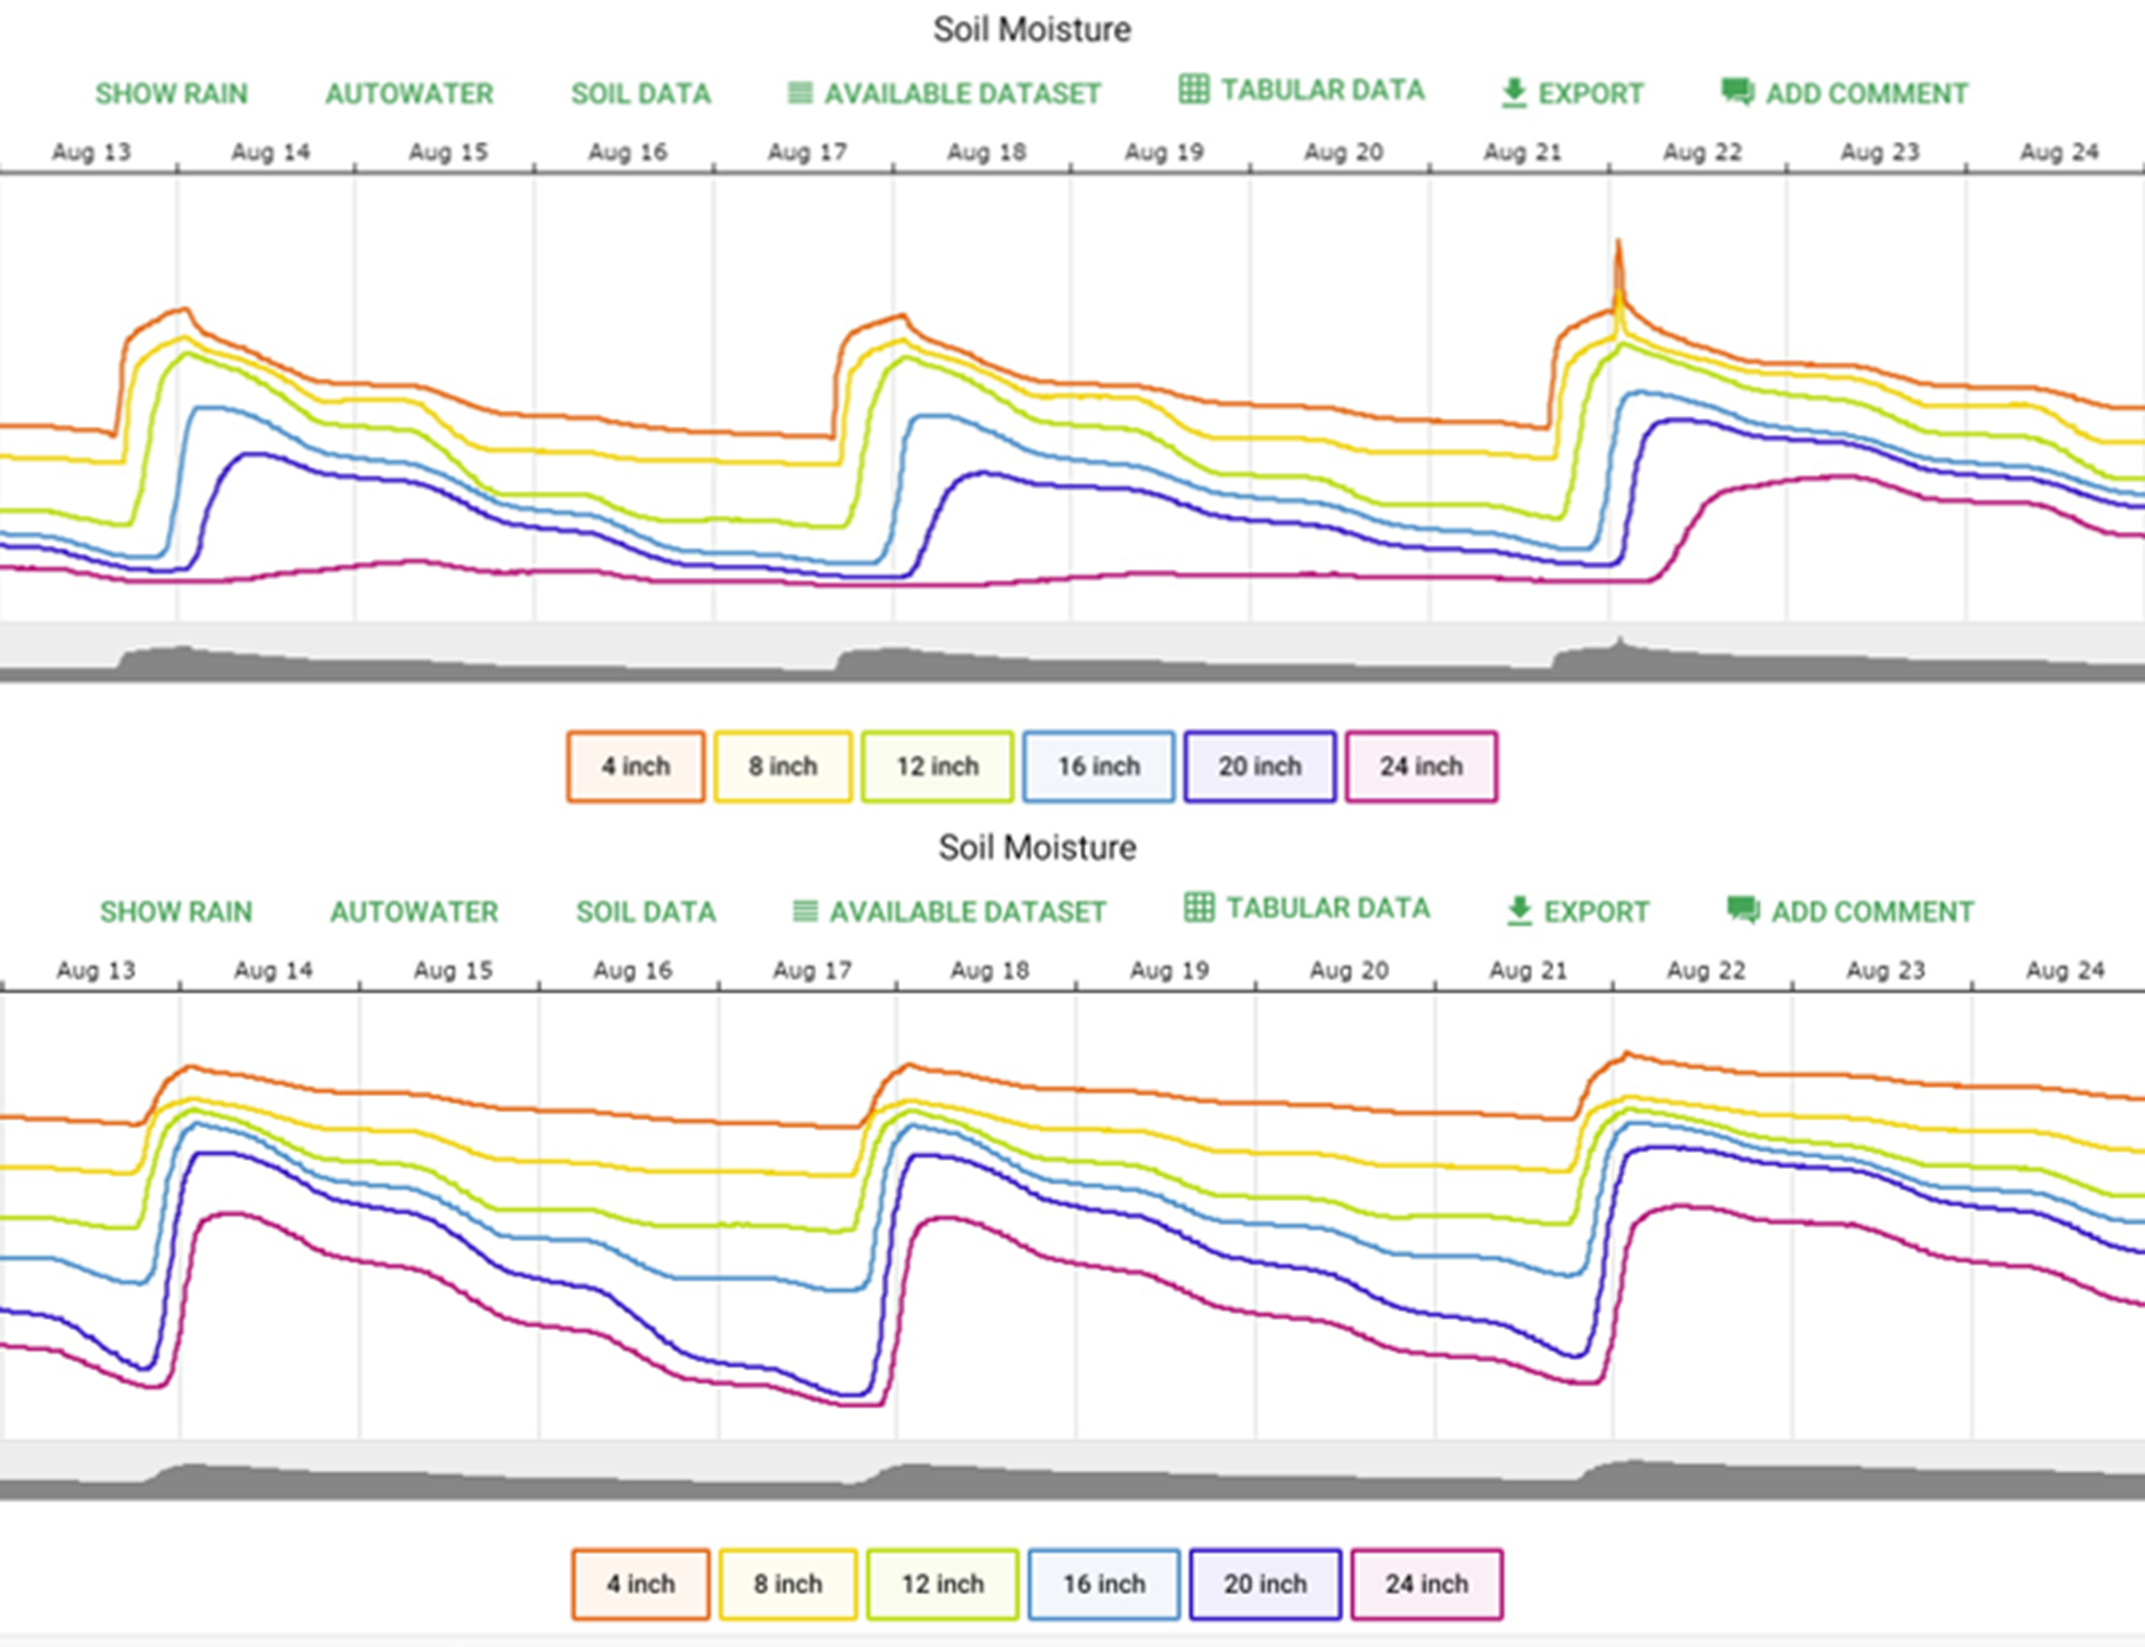
Under SD delivery, initial peak soil water content occurs first in the soil surface with subsequent peaks occurring at each lower depth. A sharp increase in water content during the third peak represents a brief rainfall event.
Conversely, under DRZ, soil water peaks initially near the 24-in. depth with subsequent peaks occurring incrementally at each upper 4-in layer of the soil profile. With deeper placement of the sensors, peaks are also found to occur incrementally at lower depths as well, mirroring the pattern in the soil profile above the 24-in point of delivery.
Figure 2 displays the soil water content in a bar graph with maximum soil water content shown in orange, lowest soil water content shown in yellow, and the difference shown in green. The latter amount represents potential water use between irrigation events.
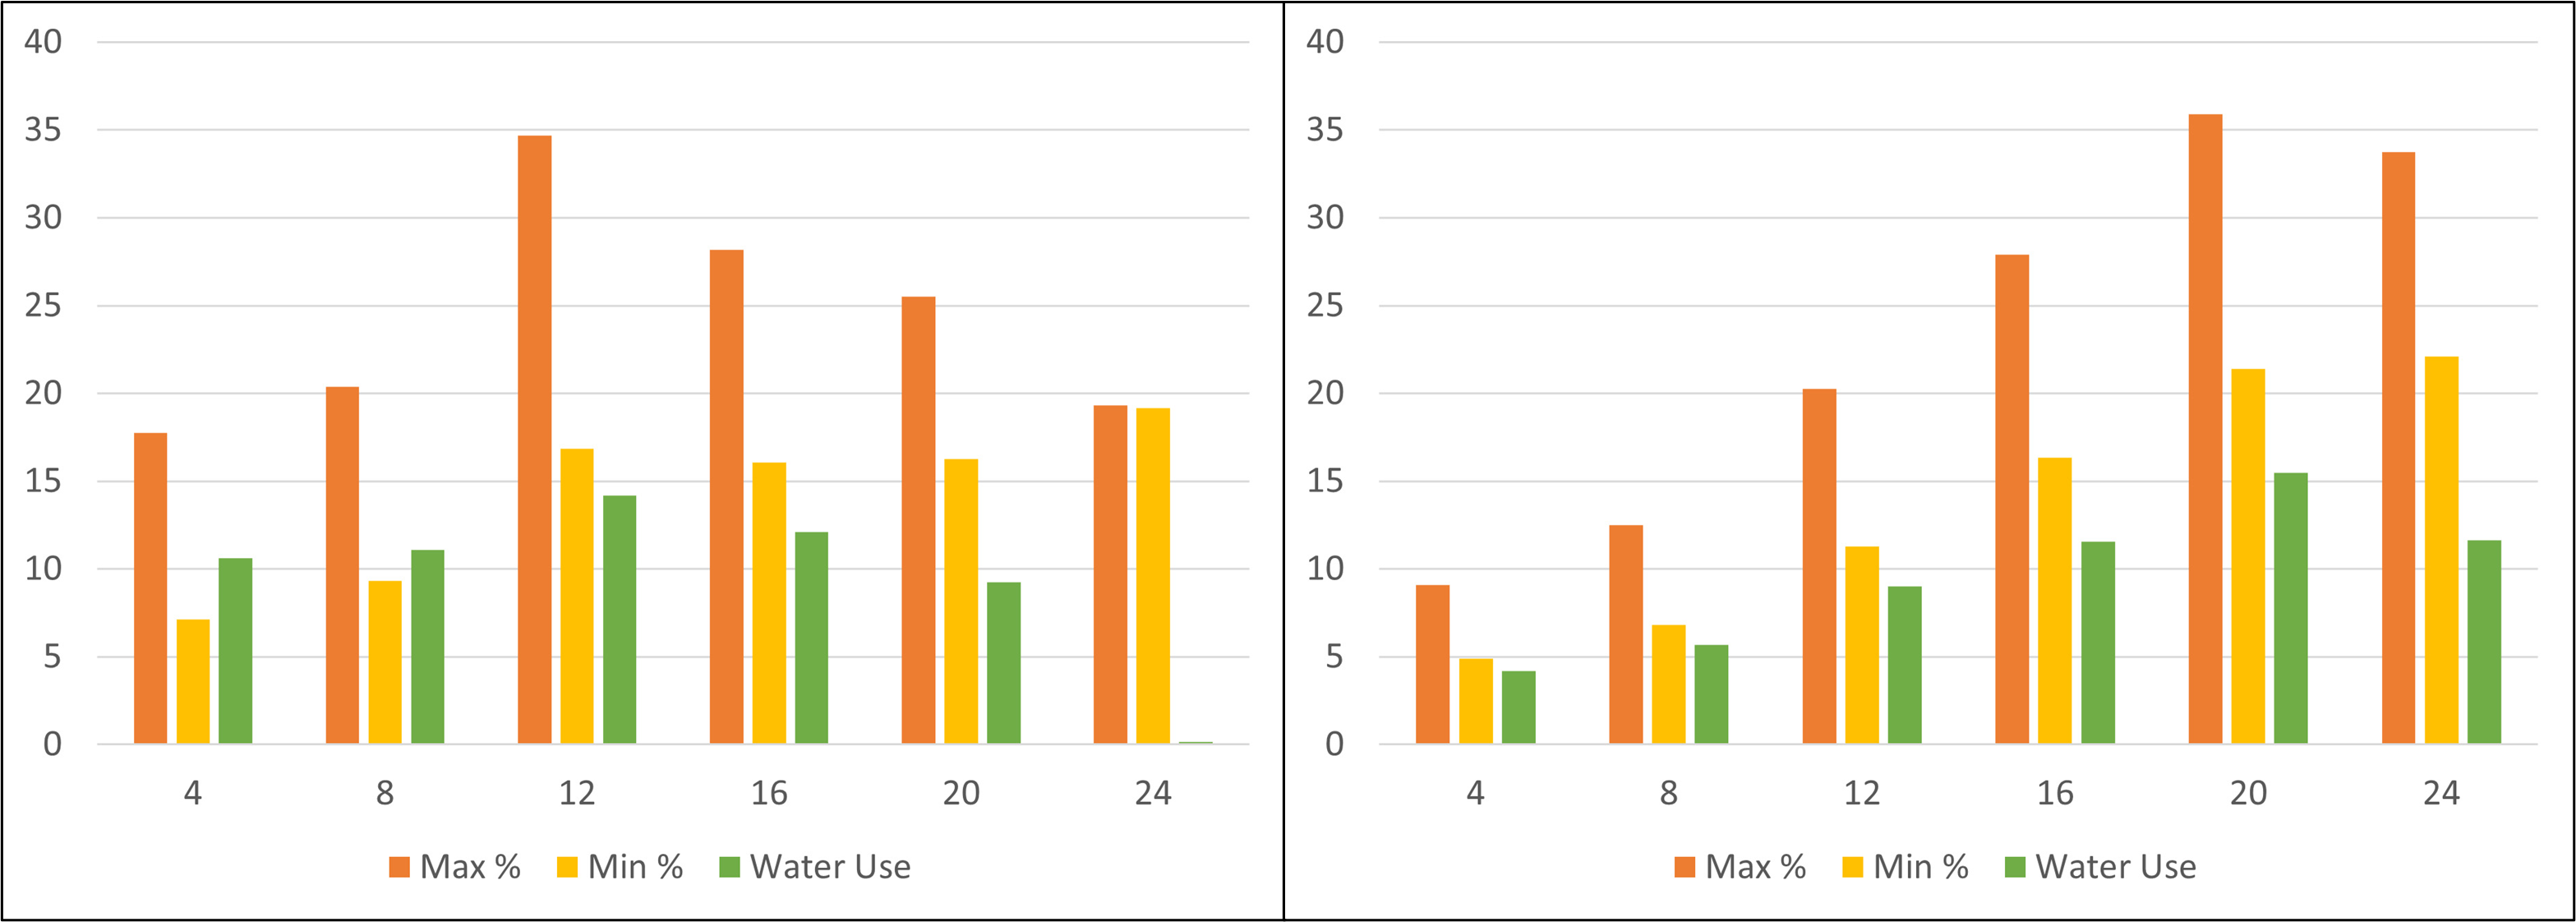
Soil water content under SD delivery is less in the upper 8 in. of the soil profile, which may be indicative of surface evaporation and resultant wicking action. Spreading action from the SD delivery method could also contribute to this water loss.
Soil water content is much higher in the lower soil profile, as is the amount of water use. The bulk of root mass has been found to be in the top 18-in. depth of the soil profile under SD delivery. Whereas, root mass under DRZ has been found to be greatest in the lower portion of the soil profile, indicating a shift in root architecture to deeper in the soil profile to obtain available water in these zones when less is applied to the upper portion.
Figure 3 displays data from an array of soil water tensiometers under both SD and DRZ deliveries during the same time period as that displayed in the previous two figures. Under SD soil water is shown be available to greater extent in the upper 18 inches of the soil profile than at the measured zones below. Conversely, the DRZ delivery is shown to have much higher water availability below the upper 18-in. depth.
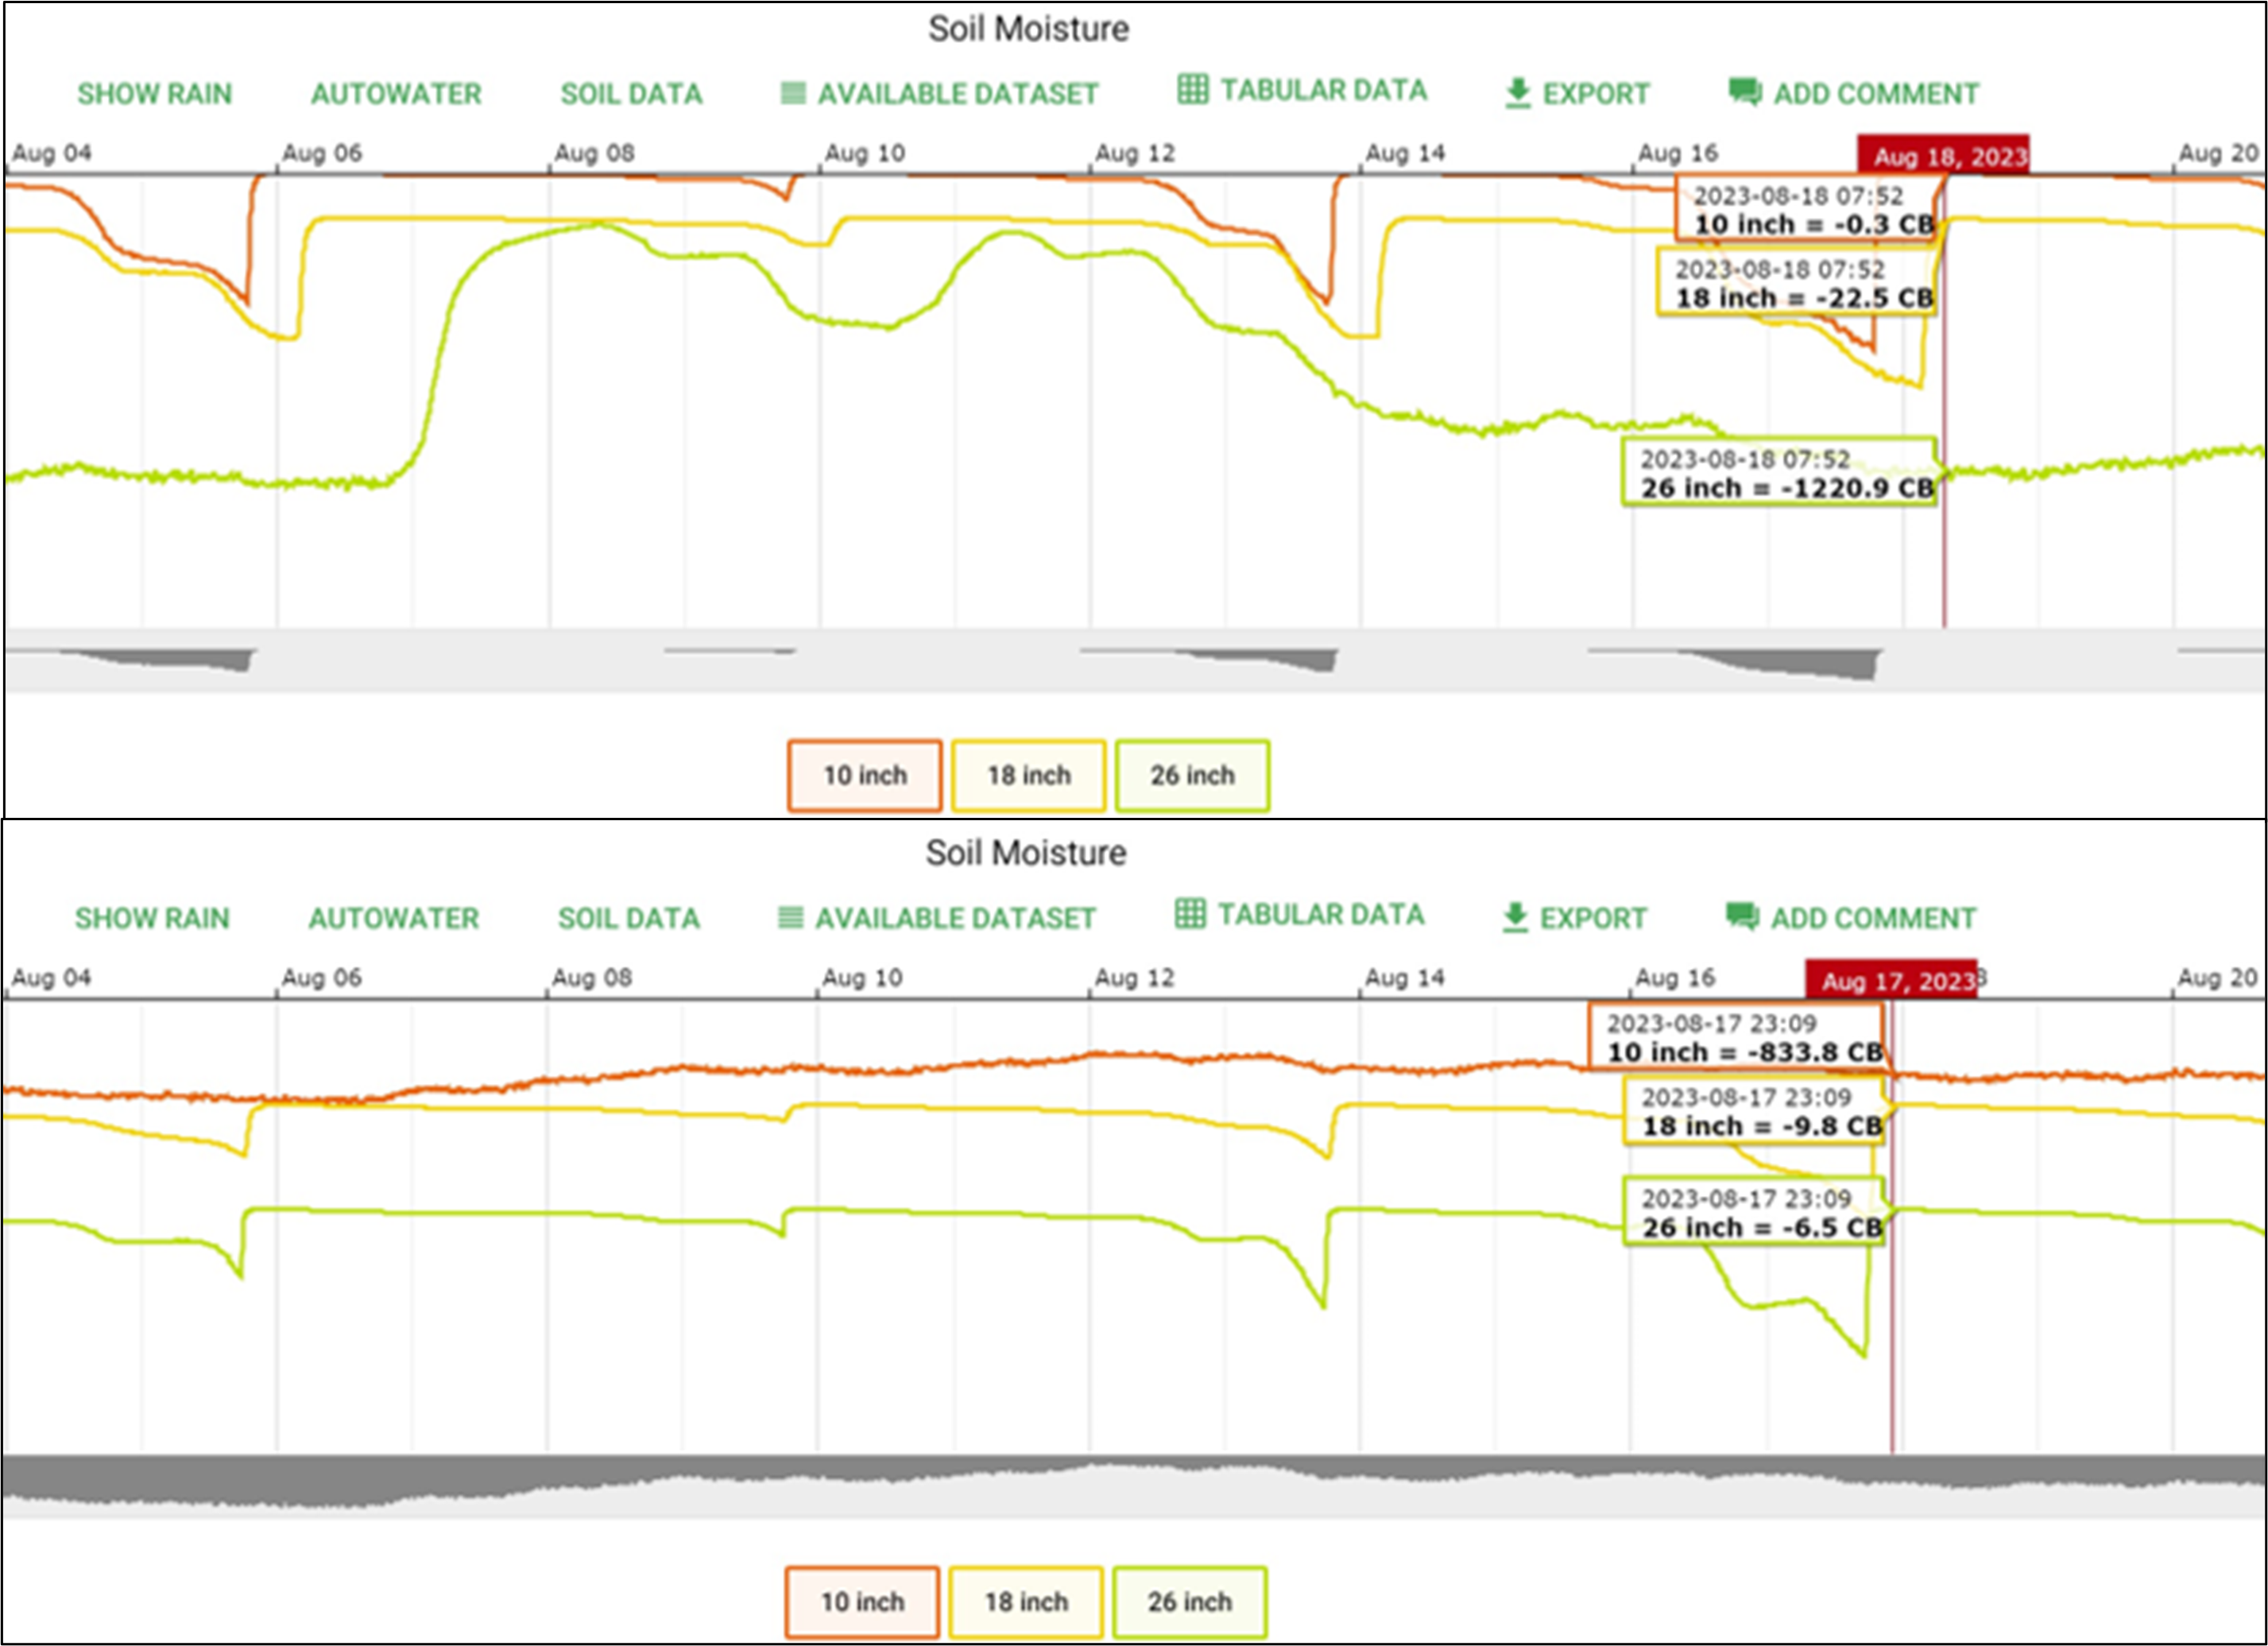
This finding supports a beneficial aspect of DRZ which creates a dry layer in the upper soil profile that may form a barrier to soil water loss to the atmosphere through surface evaporation and wicking effect.
The other observation from these figures is the relative amount of potential water stress placed on the vines as indicated by the shaded area below each chart.
The top chart shows four periods of short duration under which soil water stress is depicted in the shaded areas; while the bottom chart shows more constant levels of higher stress placed on the vines watered by DRZ.
This finding provides evidence that under DRZ, use of RDI may be more effectively employed to enhance wine grape quality than under SD water regimes.
Implications for Efficient Irrigation Management
Use of subsurface irrigation has potential to increase crop water use efficiency, while enhancing grape quality, and maintaining yields.
Use of sensors to better schedule irrigation or implement automated systems is an emerging trend for enhancing production efficiency. DRZ is a method for consideration by wine growers in the drought-prone irrigated regions in the western U.S. Soil water sensors can help guide irrigation application rates and scheduling to achieve optimum crop water productivity.
Acknowledgements
Project funded by the WA Wine Commission and the WA State Grape and Wine Research Program, the Northwest Center for Small Fruit Research, and the WSDA – SCBG Program. Special thanks to Scott Williams of Kiona Winery and Vineyards for providing collaboration and encouragement.
Washington Wine Research is Accessible to All
Author: Melissa Hansen, Research Program Director, Washington State Wine Commission
Research and Innovation webpage supports robust wine research program
The Washington State Wine Commission’s (WSWC) research program has two main purposes: to support research relevant to Washington’s wine industry and share it with the state’s wine grape growers and wineries. The Research and Innovation web page on the Washington Wine Commission’s website serves as the industry’s central research warehouse.
The research web page is a great place to learn about the history of the Washington wine industry’s connection with research, its research partner Washington State University, and how viticulture and enology research is funded. You can also view past presentations and videos from WAVE and WAVEx, the research seminars and webinars that are co-sponsored by WSU and the WSWC, and view a list of ongoing research projects (WAVE: Washington Advancements in Viticulture and Enology.)
But the workhorse of the research web page is the Research Library: it plays a critical role in helping to make research accessible to all.
Research Library
The research library houses more than 100 research project summaries, reports, presentations, news articles and more for your reference, education and curiosity. Of keen interest are the final reports of research supported by the Washington wine industry and related articles in open access research journals and trade publications that can be downloaded for future reference.
All research reports and articles are searchable by the following topics:
- Viticulture
- Pest and Disease
- Enology
- Irrigation
- Soil health and Nutrition
- Technology
- Yeasts
- Smoke Exposure research and resources
- WAVE proceedings, presentations
- Wine Research Advisory Committee meeting minutes
- Grants
Prior to 2015, the Washington wine industry lacked a process to catalog and make accessible reports of research projects that had been funded by the Washington wine industry. That changed when the WSWC amped up its research program in 2015 and hired a fulltime research director. As the program was developed, stakeholder accessibility and transparency of research outcomes were identified as top priorities. Thus, one of the first tasks was to create an internet home for research reports that could be easily accessed by all.
Each report posted on the Research Library includes a short summary of key findings to help readers decide if they want to dive deeper and read the full report. The principal investigator information is shared so that readers can contact the scientist directly if they have questions. The Research Library also contains resources related to smoke-exposed grapes and wine that were developed by the West Coast Smoke Exposure Task Force, of which the Washington State Wine Commission is a member.
Research at Your Fingertips
Sharing research results is a year-round effort. The WAVE Research Report digital newsletter is published every other month to communicate upcoming research events, spotlight key findings of research projects, profile scientists and graduate students, share research in the news, and more.
Research news is also shared in the WSWC’s monthly newsletter that’s sent to grower and winery constituents. Additionally, technical research reports are summarized and annually published in trade publications, such as the Good Fruit Grower and Wine Business Monthly. And for those who like to hear firsthand from scientists, the WAVE and WAVEx research seminars and webinars have become the signature research event to disseminate information to growers and vintners.
Delivering research findings to stakeholders goes together with supporting research. Research information has little use if it’s hidden in a written report housed in a binder on an office shelf. The goal of the industry’s research program is to provide the Washington wine industry with science and data-driven tools to stay competitive. To achieve that goal, growers and winemakers must be able to access the data. From the smallest grower to the largest winery, all are constituents of the WSWC and have invested in research.
We’ve made it as easy as possible to stay informed with the latest innovations. If you aren’t receiving research news, what are you waiting for? You could be missing valuable information!
Send an email to:
mhansen@washingtonwine.org to get on the research email list.
