
This issue of VEEN was originally published as a .PDF in April 2025, and posted online. That issue is now archived, but accessible on the VEEN Archive webpage.
VEEN is curated by WSU Viticulture Extension. For questions on articles, or to request to submit an article in future issues, reach out to Michelle Moyer.
A Note from the Editor
Spring is here, noted by our April showers, frantic final pruning, and calls of first budbreak coming in. Fortunately this spring, at least weather-wise, is starting off less chaotic than last year. With relatively mild conditions, there has been very little mid-winter cold damage to report. We are, though, heading into the irrigation season with low water reserves, so will need to stay vigilant in watering practices that not only consider vine needs, but also water availability in case of potential rationing.
Speaking of the weather, this issue of VEEN is featuring several articles from AgWeatherNet, highlighting the great work they have been doing in expanding both their weather station networks, but also the models and decision-aid tools that are powered by those networks. In addition, we have an article featuring how weather conditions, among other factors effect fruit set. To round things out, we have an update article on non-chemical weed management approaches for vineyards, as well as a feature announcement about the RAVENHOLT / WAVE Lecture Series on April 23, 2025.
Table of Contents
- Poor Fruit Set in Grapes: Causes and Mitigation Practices
- A New Tool to Estimate Inversion Strengths
- Weather-Based Guidance for Safe Vineyard Spraying
- AWN Smart Farm: Private Sensing Networks for Vineyards
- Putting Sustainability in Action
- WSDA Pesticide Licenses – New Requirements for License Holders
Did you know…
… That we have a YouTube Channel?
Watch several curated, and shared, video playlists! From webinars on invasive species, to educational videos on weather data and fungicide resistance, we’ve got something for everyone!
Follow us by searching for our YouTube handle: @WSUVitEnolExt
Poor Fruit Set in Grapes: Causes and Mitigation Practices
Authors: Geraldine Diverres, New Mexico State University, Markus Keller and Michelle Moyer, WSU Prosser IAREC
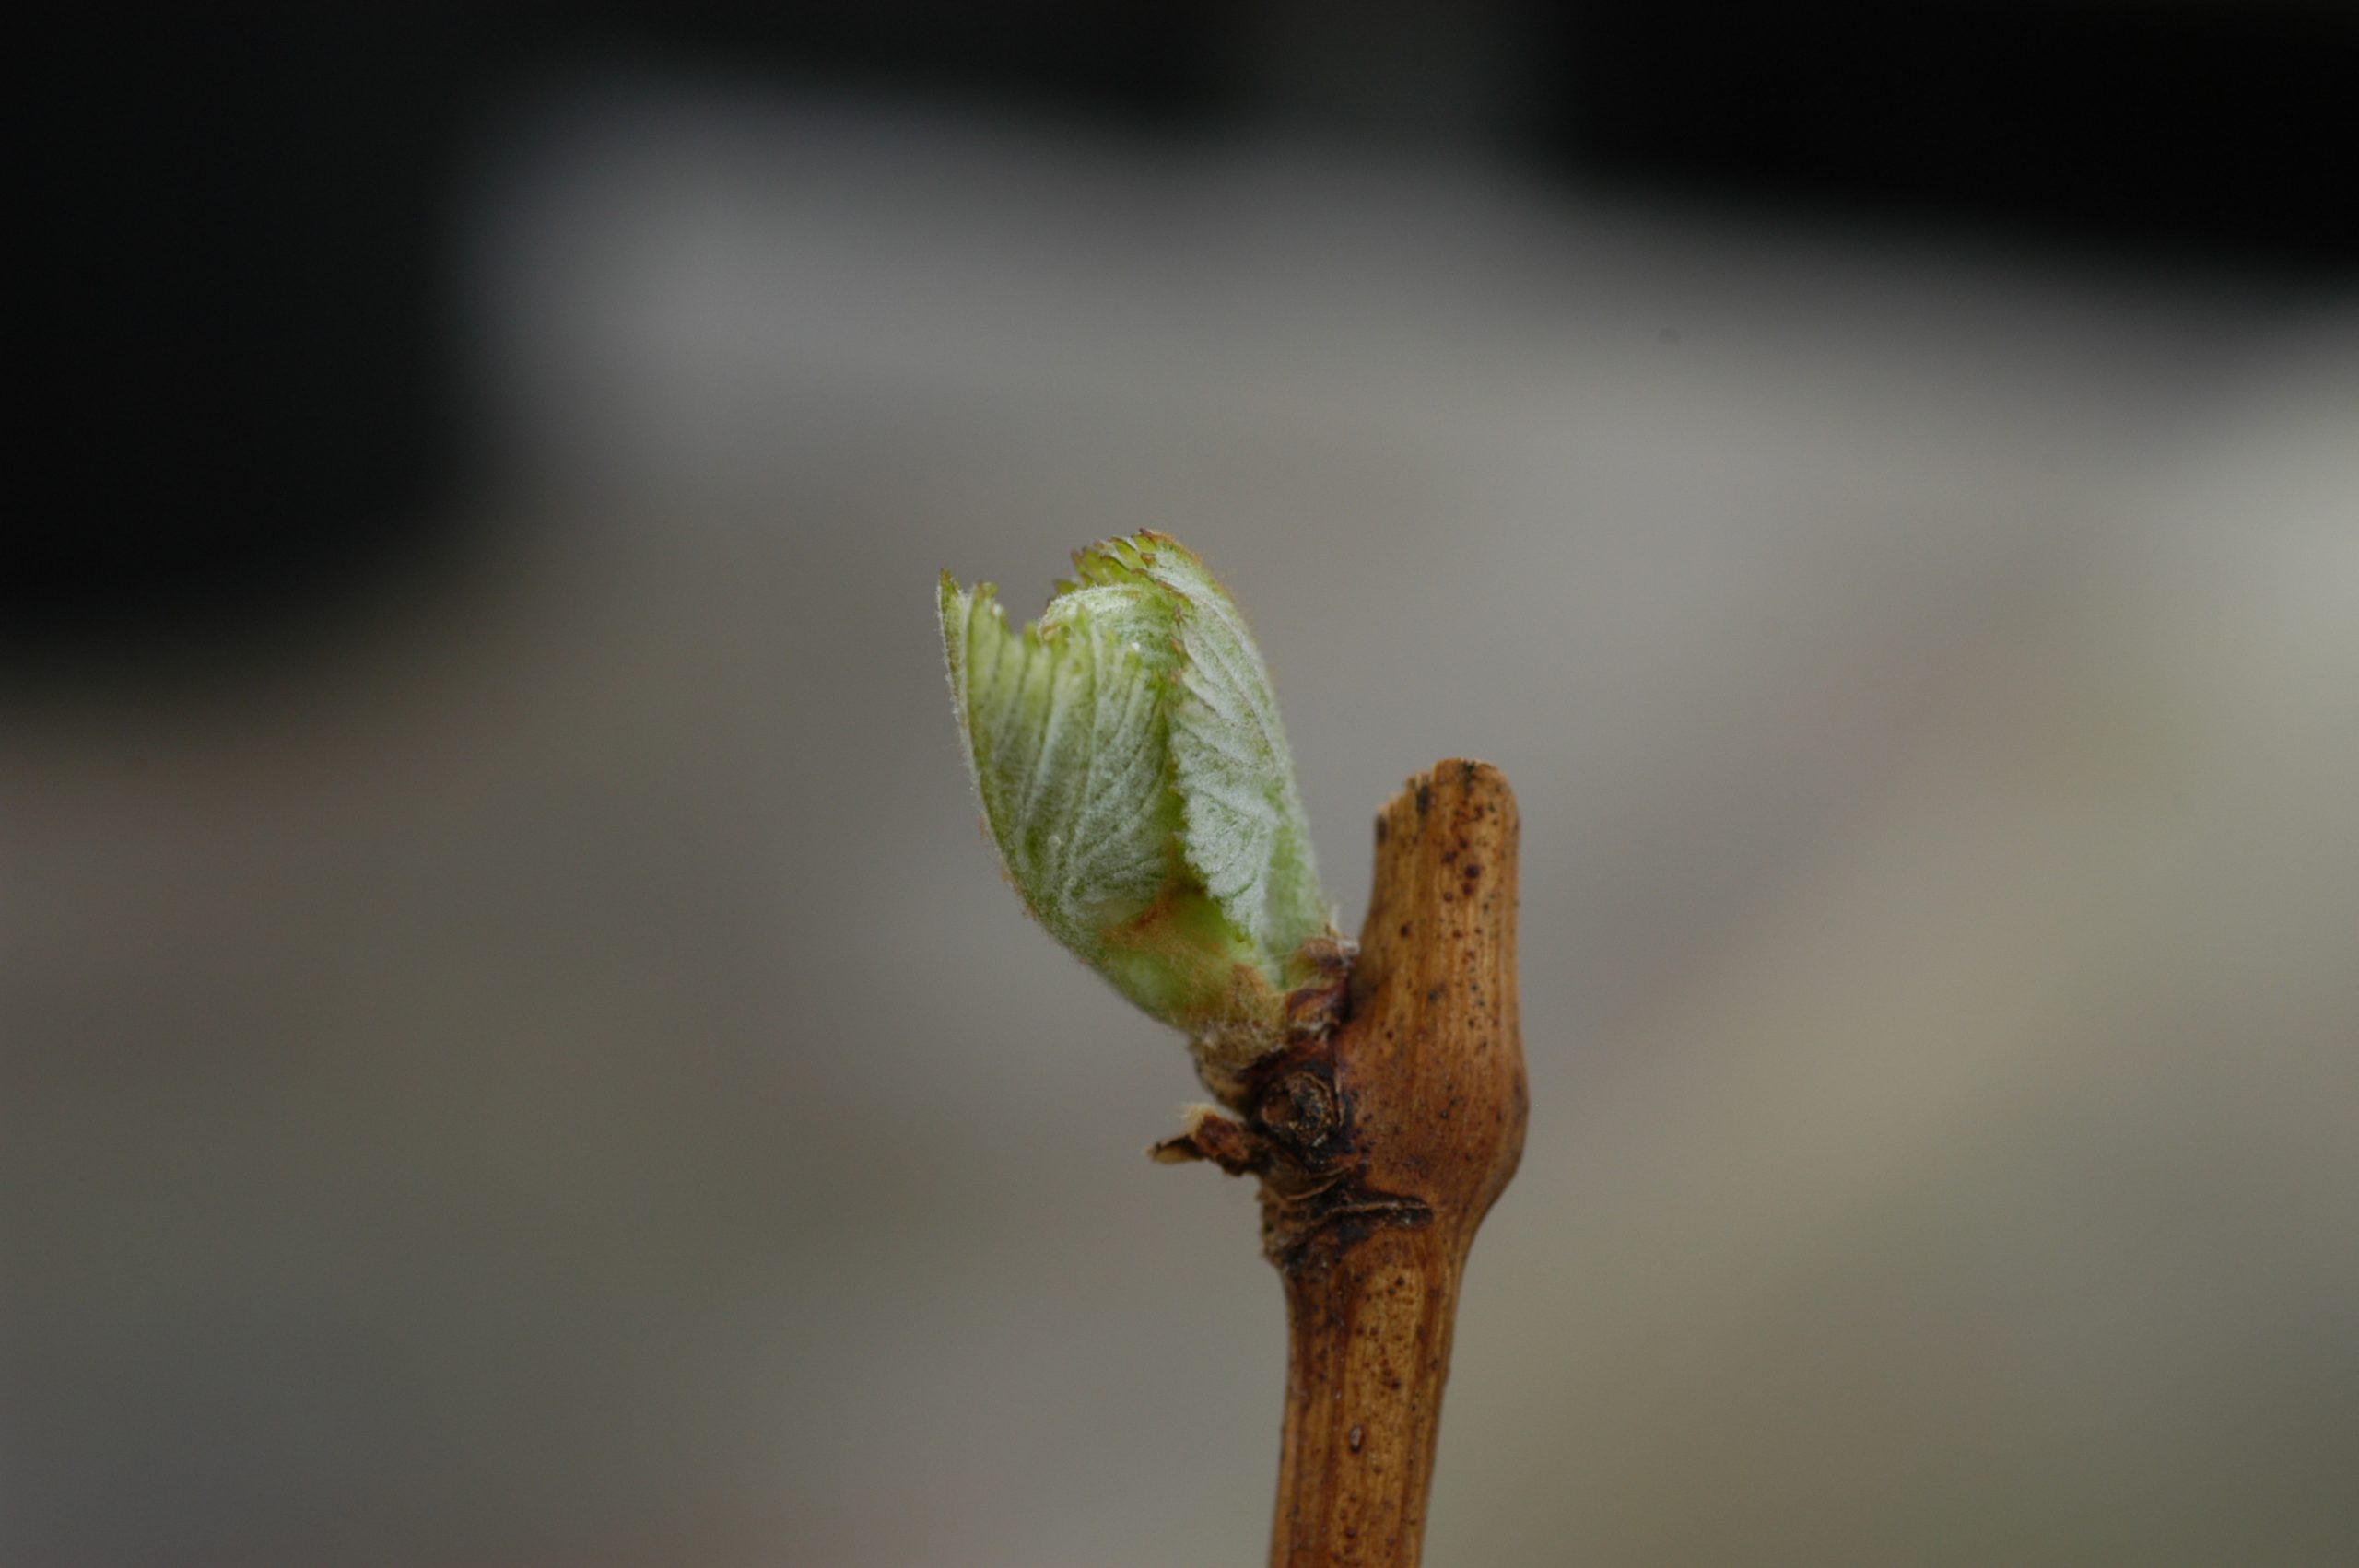
Fruit set is a key developmental stage in seasonal growth of grapevines. This stage refers to the transformation of flowers into berries, following pollination and fertilization. Disturbances in any of these processes can reduce fruit set, which may result in a decline in yield at harvest. The percentage of fruit set is one of the key factors in year-to-year variations in yield.
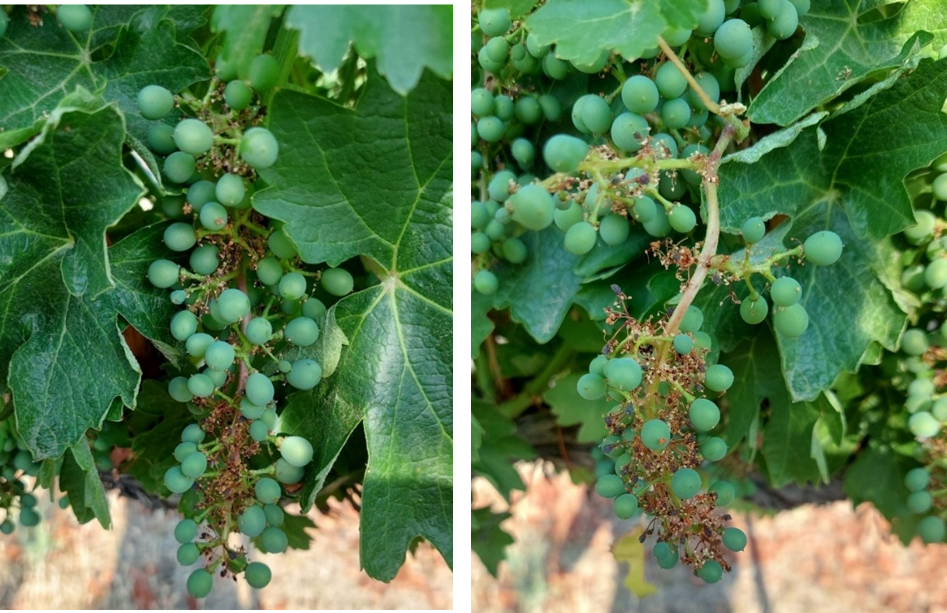
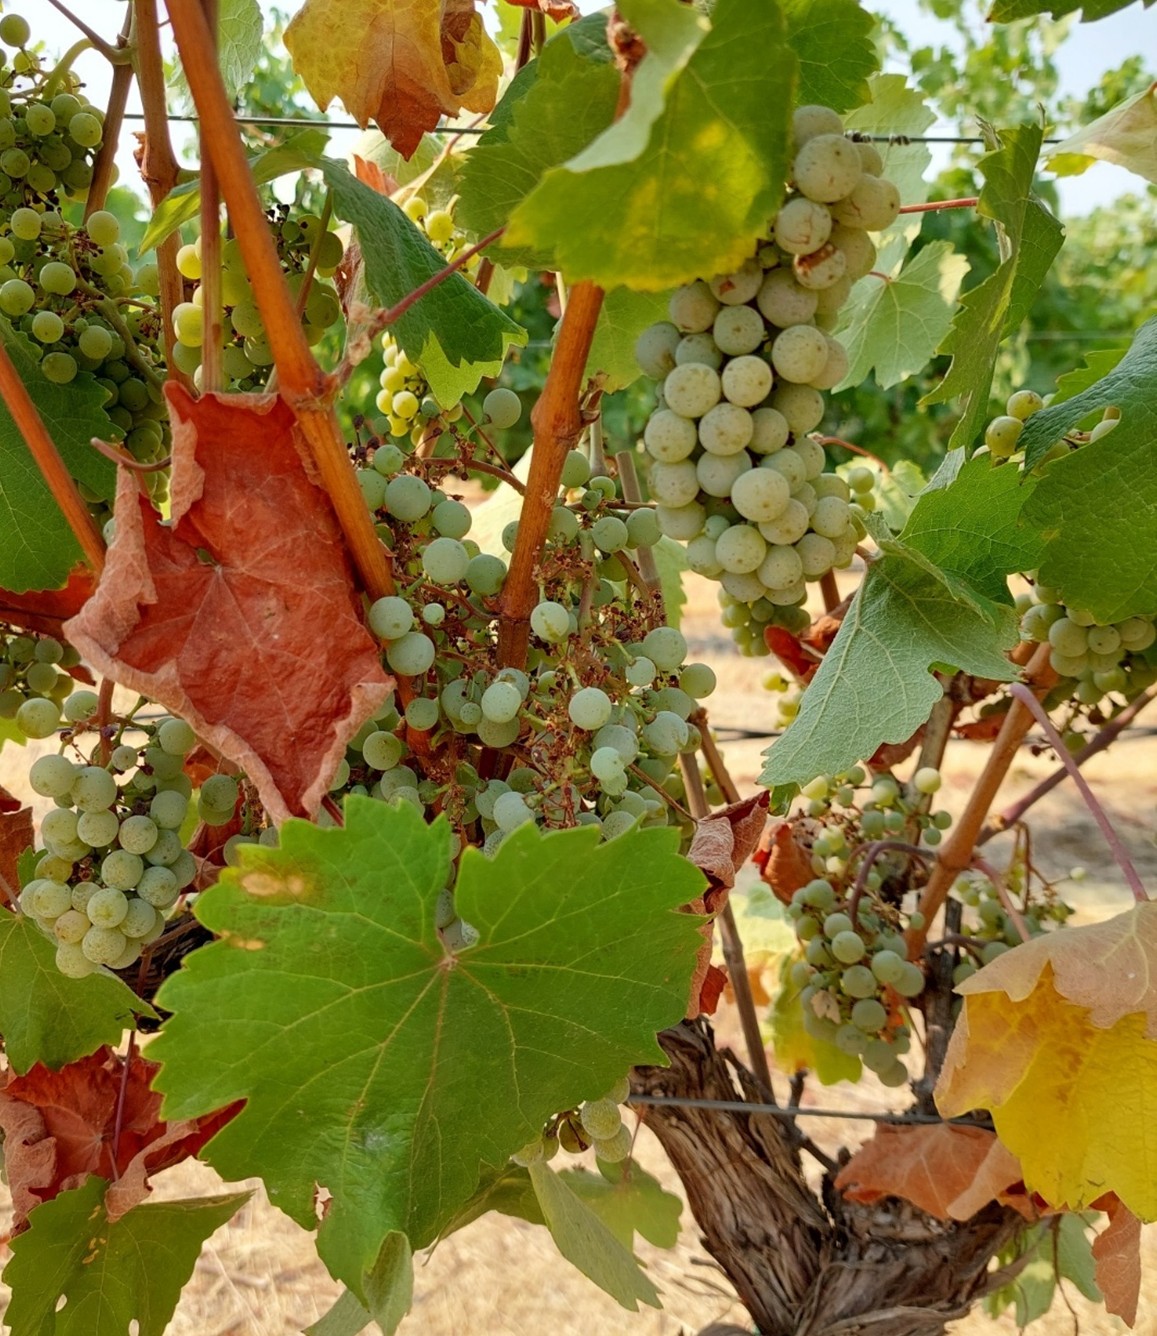
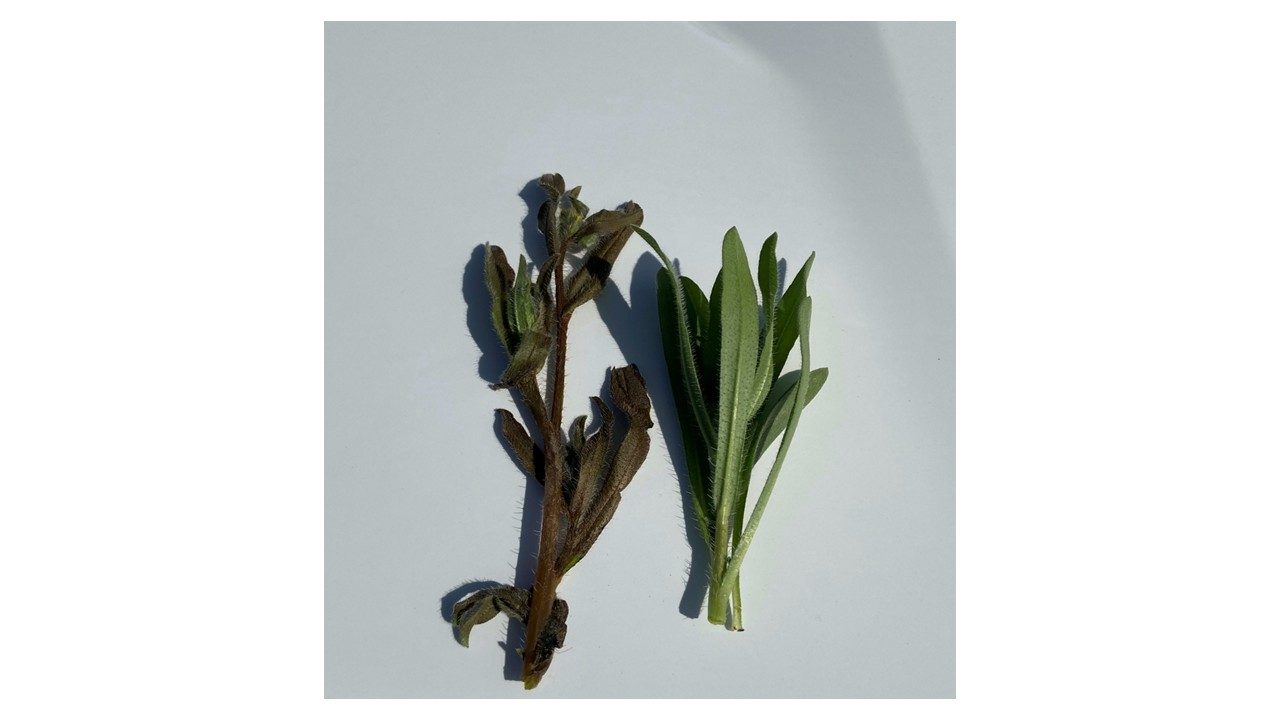
It is important to know that low rates of fruit set do not necessarily mean low yields. Grapevines can offset to a certain degree low fruit set through increased berry size, an adaptive mechanism known as yield component compensation. When fruit set rates fall below the normal range for a particular variety, the condition is called shatter or poor fruit set (Fig. 1). This situation becomes problematic when it leads to a significant reduction in yield.
High fruit set is not always desirable. Certain varieties tend to produce many flowers and have high fruit set. The resulting cluster may have berries tightly pressed together and can suffer from uneven ripeness and berry splitting, which can increase the risk of harvest rots.
What causes poor fruit set in the vineyard?
Poor fruit set can result from uncontrollable environmental factors or from management-related issues. Understanding the difference is critical, since not all poor fruit set is a consequence of mismanagement.
The causes of poor fruit set can be grouped into three main categories:
- Genetic factors – Factors intrinsic to the variety or rootstock, like the number of flowers in a cluster or the drought and salinity tolerance.
- Weather limitations – Factors that are largely outside the grower’s control, such as hot or cold temperatures, strong wind, or rainfall.
- Physiological & management derived causes – Internal vine processes influenced by both genetic and environmental factors, as well as controllable decisions around vineyard management practices.
Genetic factors
Genetic factors are characteristic of a given variety, clone or rootstock. Certain varieties like Vitis vinifera ‘Grenache’, ‘Malbec’, or ‘Merlot’ can experience fruit set problems frequently. Other varieties have a naturally low number of berries because they produce fewer flowers, like V. vinifera ‘Tempranillo, ‘Sauvignon blanc’, ‘Chardonnay’ [1]. Conversely, some varieties may have a higher number of flowers but lower rates of fruit set.
What can you do in the vineyard? Pick varieties and clones that don’t bloom during your site’s most unpredictable weather window, like spring frost, heat spikes, or extreme winds. Rootstock selection is another important decision. Some rootstock-scion combinations may increase sensitivity to drought, reduce nutrient uptake, or alter shoot vigor, all of which can directly or indirectly impact fruit set. Vineyard design should also support healthy canopy development through appropriate row spacing, orientation, and trellis systems that maximize sun exposure and airflow.
Weather limitations
Weather is one of the most influential and least controllable factors affecting fruit set (Fig. 2). The timing and severity of adverse weather conditions will determine the degree of impact. Temperatures below 59°F can delay the process of cap fall and reduce the success of fertilization by slowing down the growth of pollen tubes [2]. Heat stress (temperatures above 95°F) during bloom are equally detrimental and can dehydrate the flowers, causing them to drop or inhibit pollen germination and pollen tube growth, decreasing the fertilization rates.
What can you do in the vineyard? Spring in some regions of Washington can bring cool temperatures, wind, and rain, all enemies of successful bloom and fruit set. Late winter pruning can slightly delay the phenology and push it into a better weather window, but don’t go too late. Research shows that this practice can be detrimental if performed after shoots have 6-7 leaves unfolded4. If the weather forecasts cool and rainy weather during bloom, shoot tip removal may improve fruit set by redirecting energy from shoot growth to flower development, but only when performed at the time of cap fall [5].
Physiological & management-derived causes
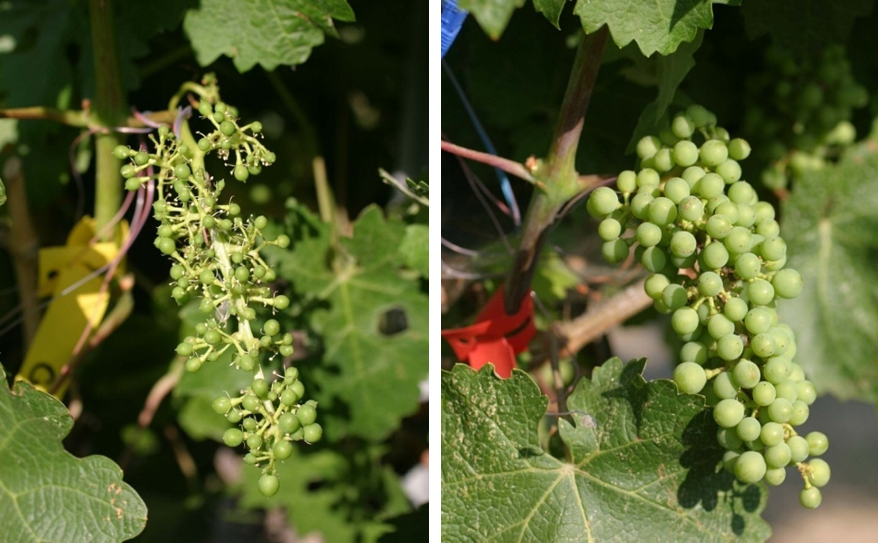
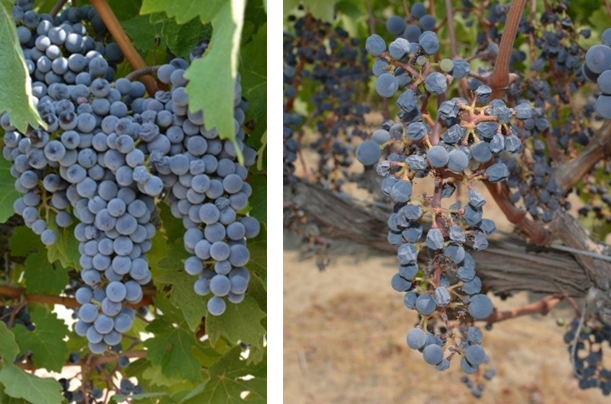
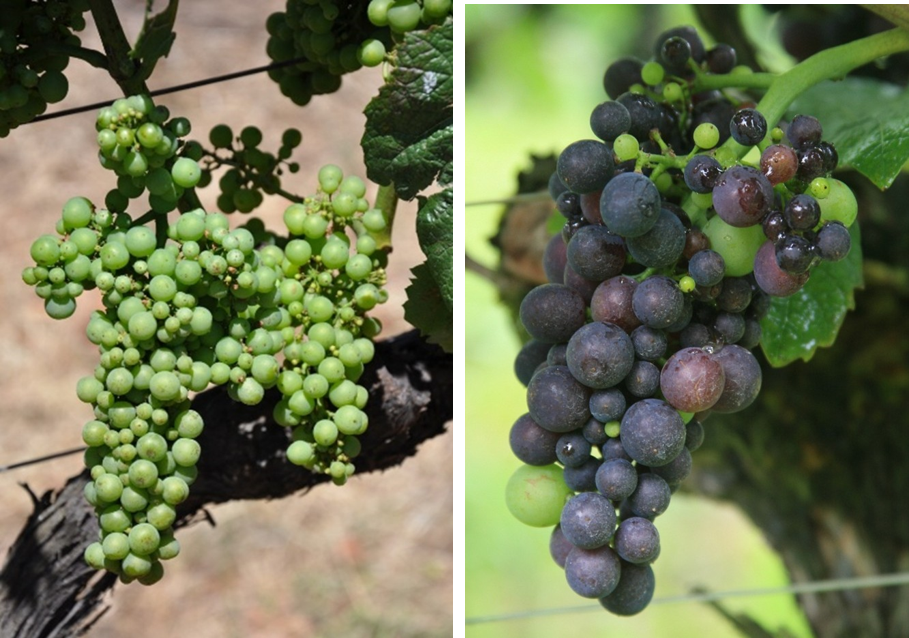
Even under ideal weather conditions, poor fruit set can still be compromised by a variety of physiological imbalances and suboptimal vineyard management practices. Grapevines need sunlight, water, and nutrient availability to succeed. If the canopy is too dense and shaded, if the vine is overcropped, or when leaf removal is poorly timed, fruit set can be significantly reduced (Fig. 3). Water and nutrient stress, especially when combined, also reduces fruit set drastically (Fig. 4) and can cause problems with seed and berry formation (Fig. 5).
What can you do in the vineyard? Supporting healthy fruit set starts with ensuring the development of a balanced vine and a functional leaf area. Prune according to vine size, aiming for 15 buds per pound of pruning weight. Timely shoot thinning helps to open the canopy, improving sunlight penetration and airflow. Avoid leaf removal during bloom unless you want reduce fruit set. If the soil moisture is below 35% of the extractable soil water content early in the season, irrigate as soon as water is available. Avoid imposing deficit irrigation until fruit set is complete. To ensure adequate nutrient supply, plan for a vineyard nutrition program that focuses on replenishing nutrients that are taken away from the vineyard with each harvest. This can be done by using both soil and vine tissue testing to determine nutrient needs. For further reading on irrigation and nutrient management, check: Irrigation Basics for Eastern Washington Vineyards and Vineyard Nutrient Management in Washington State.
Summary
Fruit set is influenced by a combination of genetic and environmental factors, and vineyard management practices. While some causes of poor fruit set are not yet fully understood and may result from a combination of different stressors, environmental conditions that reduce fruit set often do so by inducing carbohydrate starvation. The strategies to improve fruit set generally align with those that promote vine balance, the development of functional canopy and high photosynthetic rates. An open and sun-exposed canopy with sufficient leaf area, a balanced crop load, and an adequate irrigation and nutrition program creates the best conditions for successful fruit set.
References
- Dry PR et al. 2010. Aus. J, Grape Wine 16: 47-55. https://doi.org/10.1111/j.1755-0238.2009.00085.x
- Ebadi A. et al. 1995. Aus J. Grape Wine 111-18. https://doi.org/10.1111/j.1755-0238.1995.tb00072.x
- Keller M. et al. 2022. Front. Plant Sci 13: 864892. https://doi.org/10.3389/fpls.2022.864892
- Gatti M. et al. 2016. Front. Plant Sci 7: 659. https://doi.org/10.3389/fpls.2016.00659
- Coombe BG. 1962. J. Hort Sci 37: 1-15. https://doi.org/10.1080/00221589.1962.11514023
- Williams C.M.J., et al. 2005. J. Plant Nutr. 27: https://doi.org/10.1081/PLN-200030023
A New Tool to Estimate Inversion Strengths
Authors: Basavaraj Amogi, Gwen Hoheisel, Lav Khot, Washington State University and AgWeatherNet
What is an inversion?
Eastern Washington fruit production occurs in a unique landscape between two mountain regions: the Cascades to the West and the Rockies to the East. In this low-lying region, inversions occur very naturally during the winter months.
Air is typically warmer near the surface and gradually cooler at higher altitudes. An inversion occurs when a layer of warm air settles above a cooler air mass near the ground (Fig. 1).
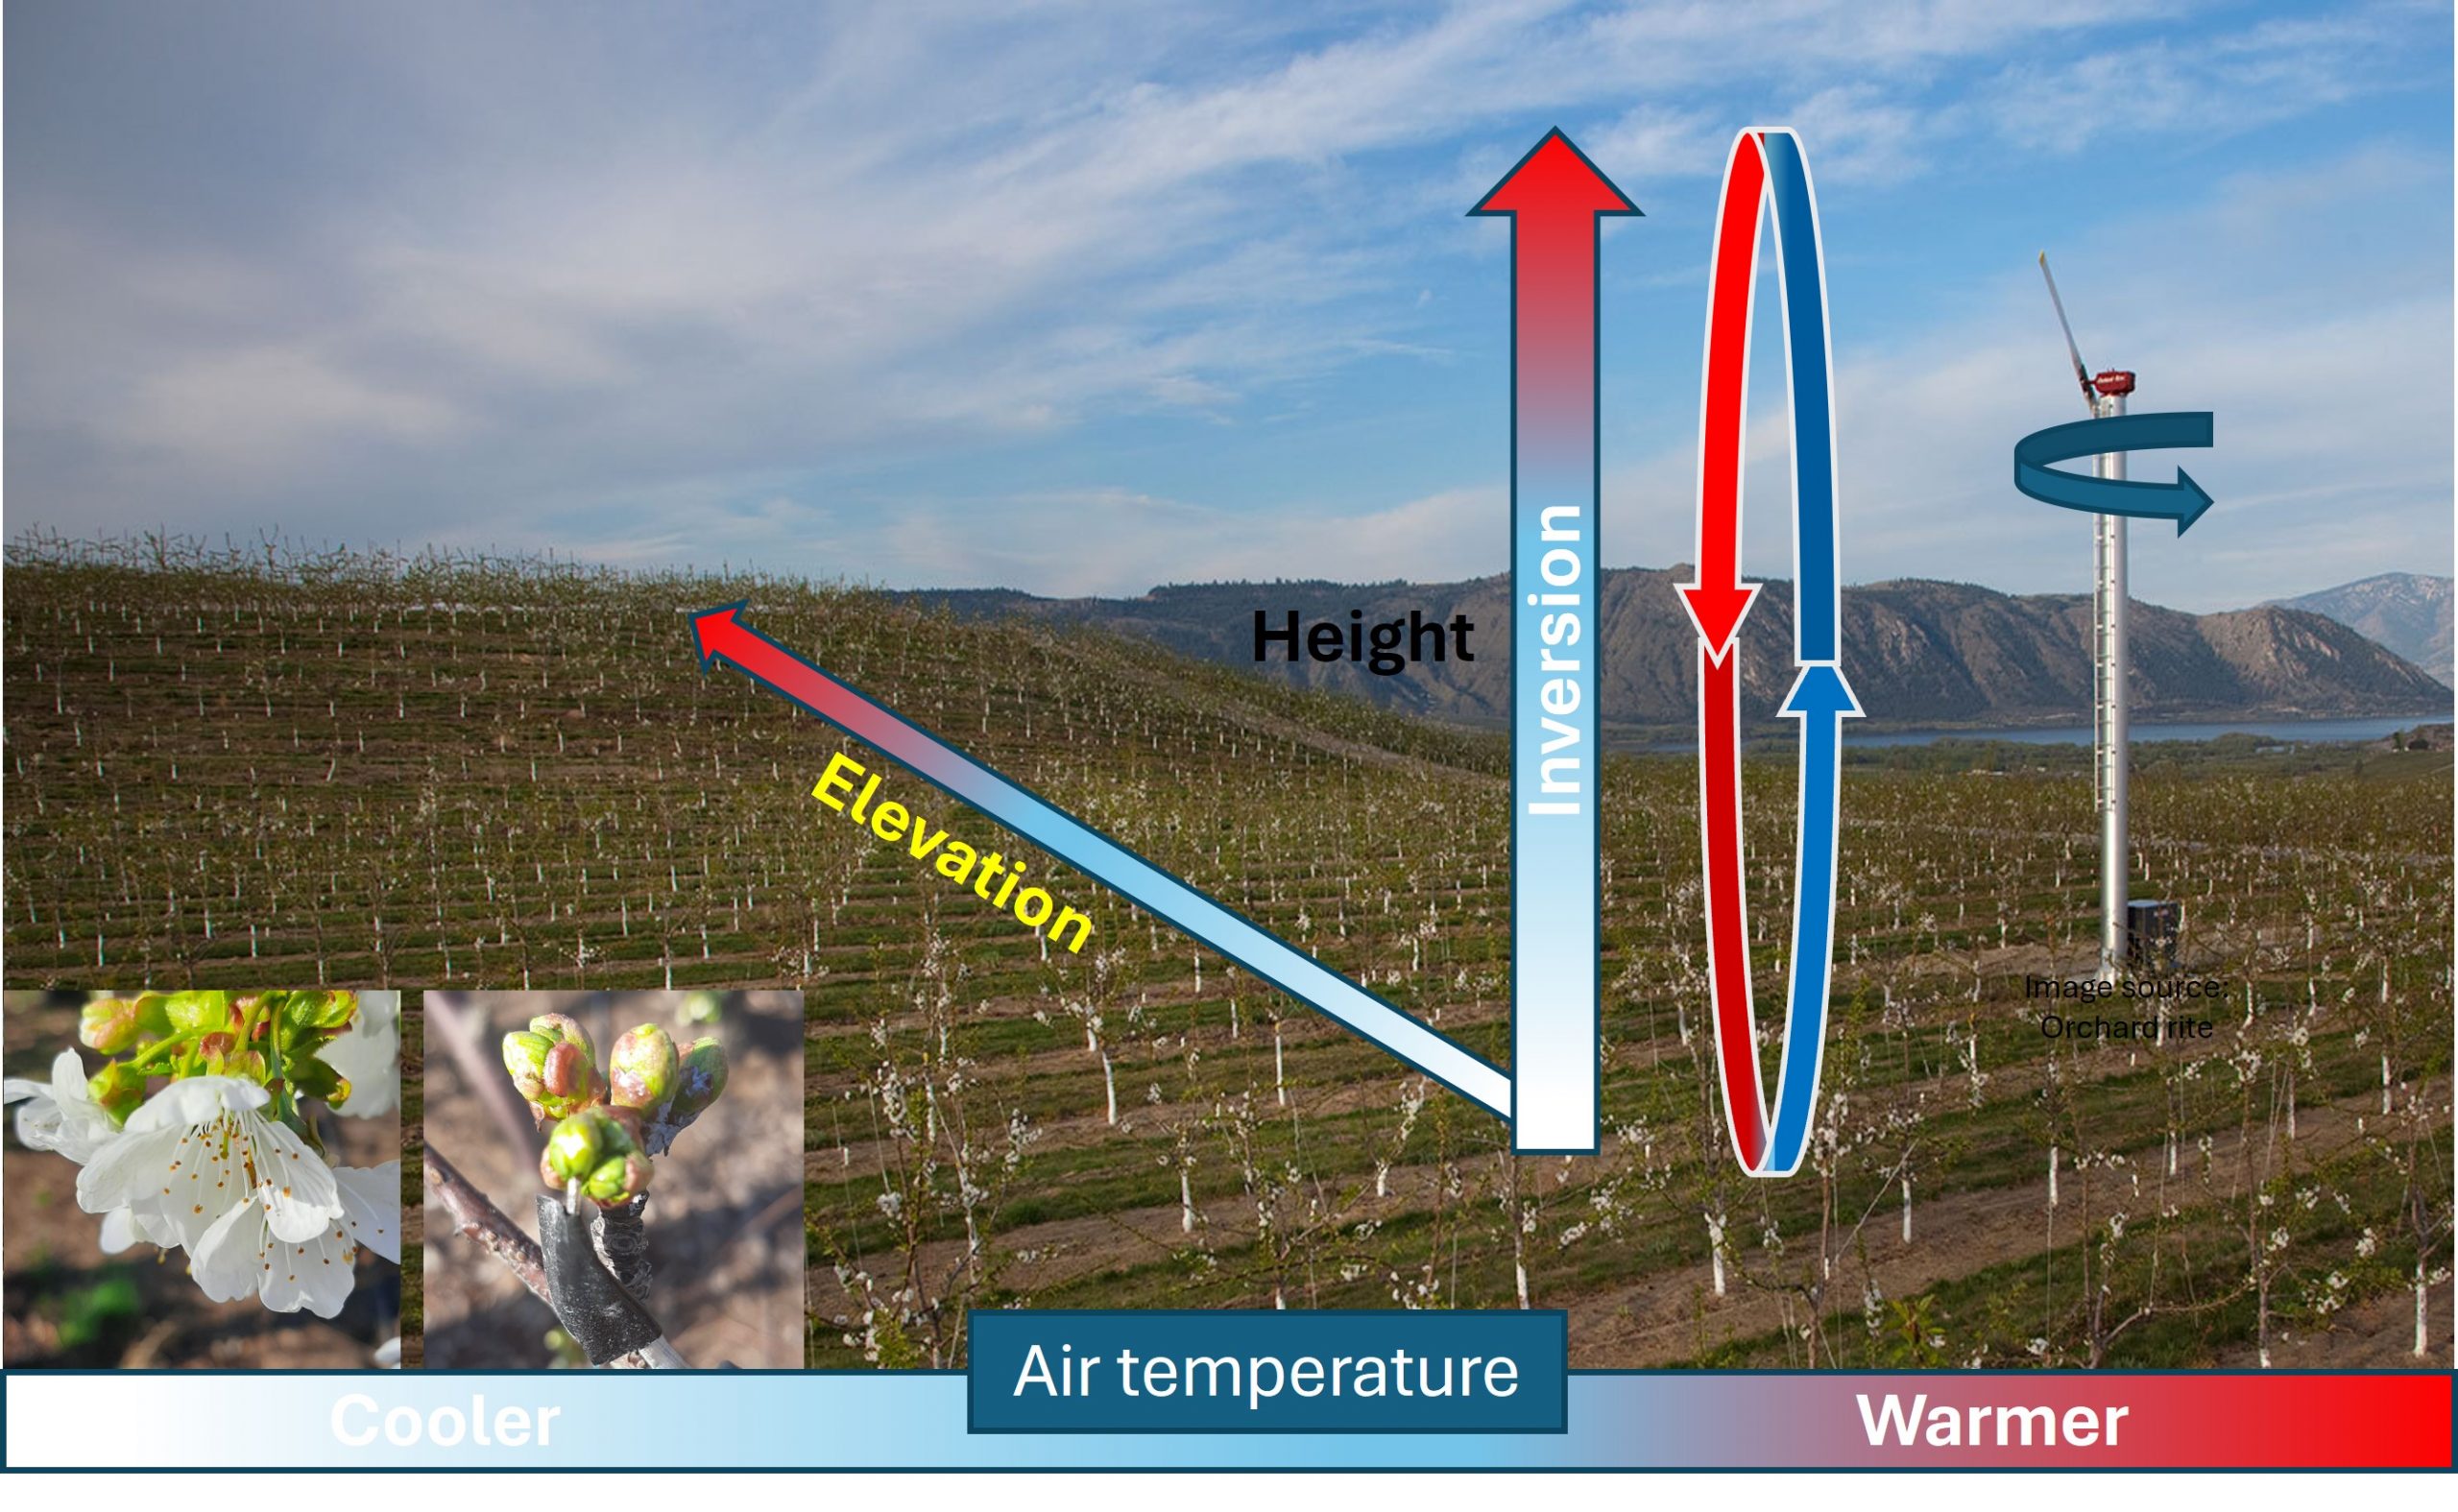
Vineyards and fruit farms on hillsides can experience distinct temperature gradients due to variations in both elevation along the slope of hill and atmospheric layering. During these inversions, wind machines can be very effective at mixing the air and reducing the risk of frost damage to grape, tree fruit, and berry crops.
There are several indicators of an inversion. Clear skies, calm wind near sunrise or sunset, and the appearance of dew or frost on foliage (which occurs if canopy cools to its dew point) all suggest inversion conditions. Fog or smoke that remains close to the ground rather than dispersing also indicates a lack of air mixing.
Inversions usually form in the evening hours as air temperature drops and then dissipate the following morning once the sun warms the surface air, provided wind speeds remain low — generally below 3 to 5 mph.
Understanding inversion strength to optimize wind machine operations
Inversion strength refers to the temperature difference between a warmer air layer above and the cooler air at, or just above the canopy height. For example, the difference in air temperature at 30 feet above canopy and 6 feet above ground. A larger temperature difference indicates a stronger inversion.
Stronger inversions offer greater potential for warming by mixing the air. Wind machines are typically most effective when inversion strength is at least 2°F, as they typically raise the surface air temperatures by about 50% of the inversion strength. For example, if the air at 30 feet is 3°F warmer than at 6 feet, a wind machine can raise the surface temperature by about 1.5°F. Wind machines also perform best when the warm air is located between 15 and 75 feet above the canopy. However, if surface air is already well mixed by wind or insulated by thick clouds, the benefit of operating wind machines becomes very minimal.
Because inversion strength plays a crucial role in determining the effectiveness of wind machine operation during frost events, AgWeatherNet (AWN) has developed new tool to predict them using tower station data and will indicate when wind machine use may be most beneficial.
Predicting an inversion strength
Although weather prediction models from National Weather Service (NWS) often predict regional occurrences of inversion conditions, localized station-specific forecasts are often more helpful for growers. Hence, AWN researchers have developed machine learning models trained on NWS forecasts and historical tower station specific weather data, effectively reducing the forecast errors.
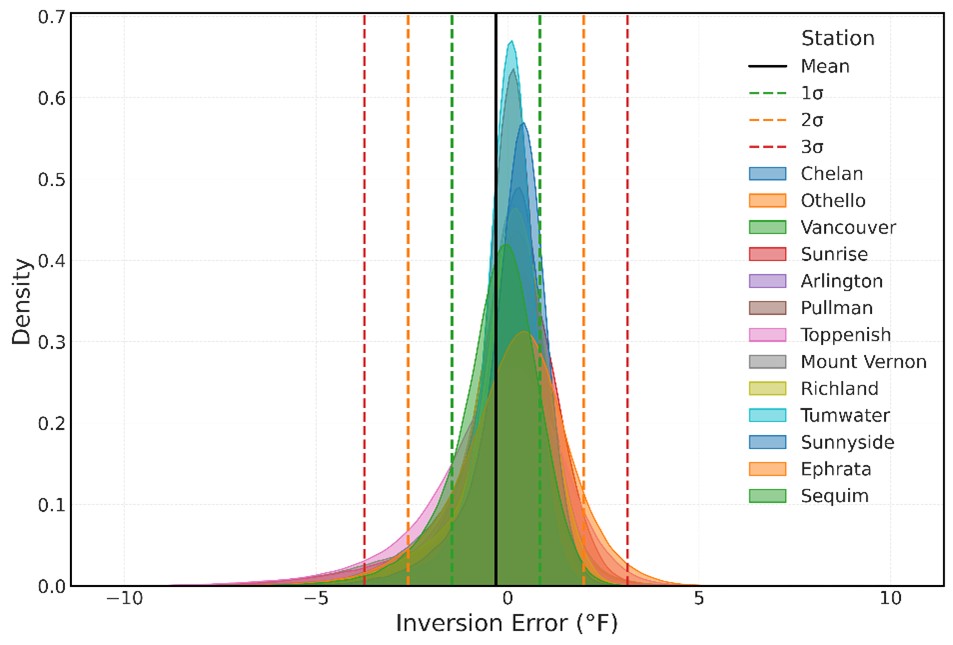
Comparisons between AWN’s station-specific forecasts and regional forecasts show that 86% of the predictions made by AWN fall within 1-2°F of actual observations (Fig. 2). As with weather forecast models, prediction accuracy degrades over longer periods, meaning the prediction error can be as high as 4-5°F with a 10-day forecast. Nonetheless, these station-specific forecasts remain valuable for estimating the strength of an inversion for the next 24 hours and determining optimal time for operating wind machines.
Accessing inversion prediction tools at AWN portal
AgWeatherNet web portal offers three primary ways to access inversion data in Washington State: (1) Map-Based Quick Access for observed inversion strength at AWN tower stations across the state, (2) Forecasts for tower stations that have at least one year of historical weather data, and (3) Forecasts, from scenario 2, overlaid on the crop-specific cold hardiness model outputs.
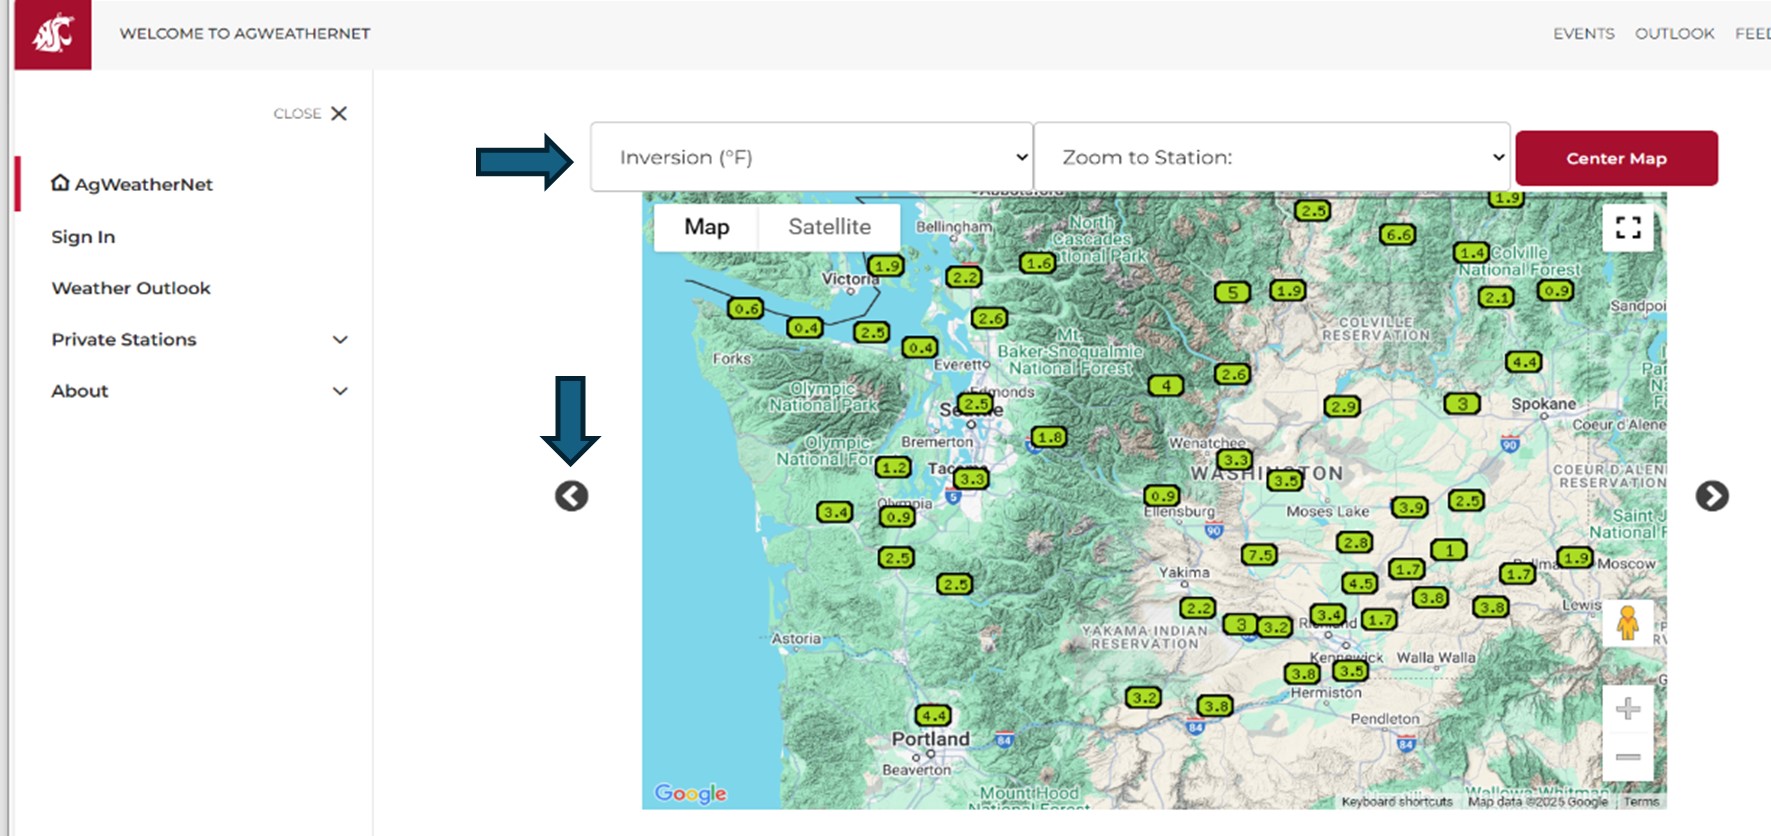
To view observed inversion strength, go to the AWN homepage, scroll through the map interface, select “Inversion” at the top, and hover over a station icon to see current readings (Fig. 3). For forecast data, users can log in to AWN web portal, navigate to Weather >> Weather Dashboard, select a relevant weather station, and open the “Air Temperature (30 FT)” tile for a detailed inversion forecast (Fig. 4).
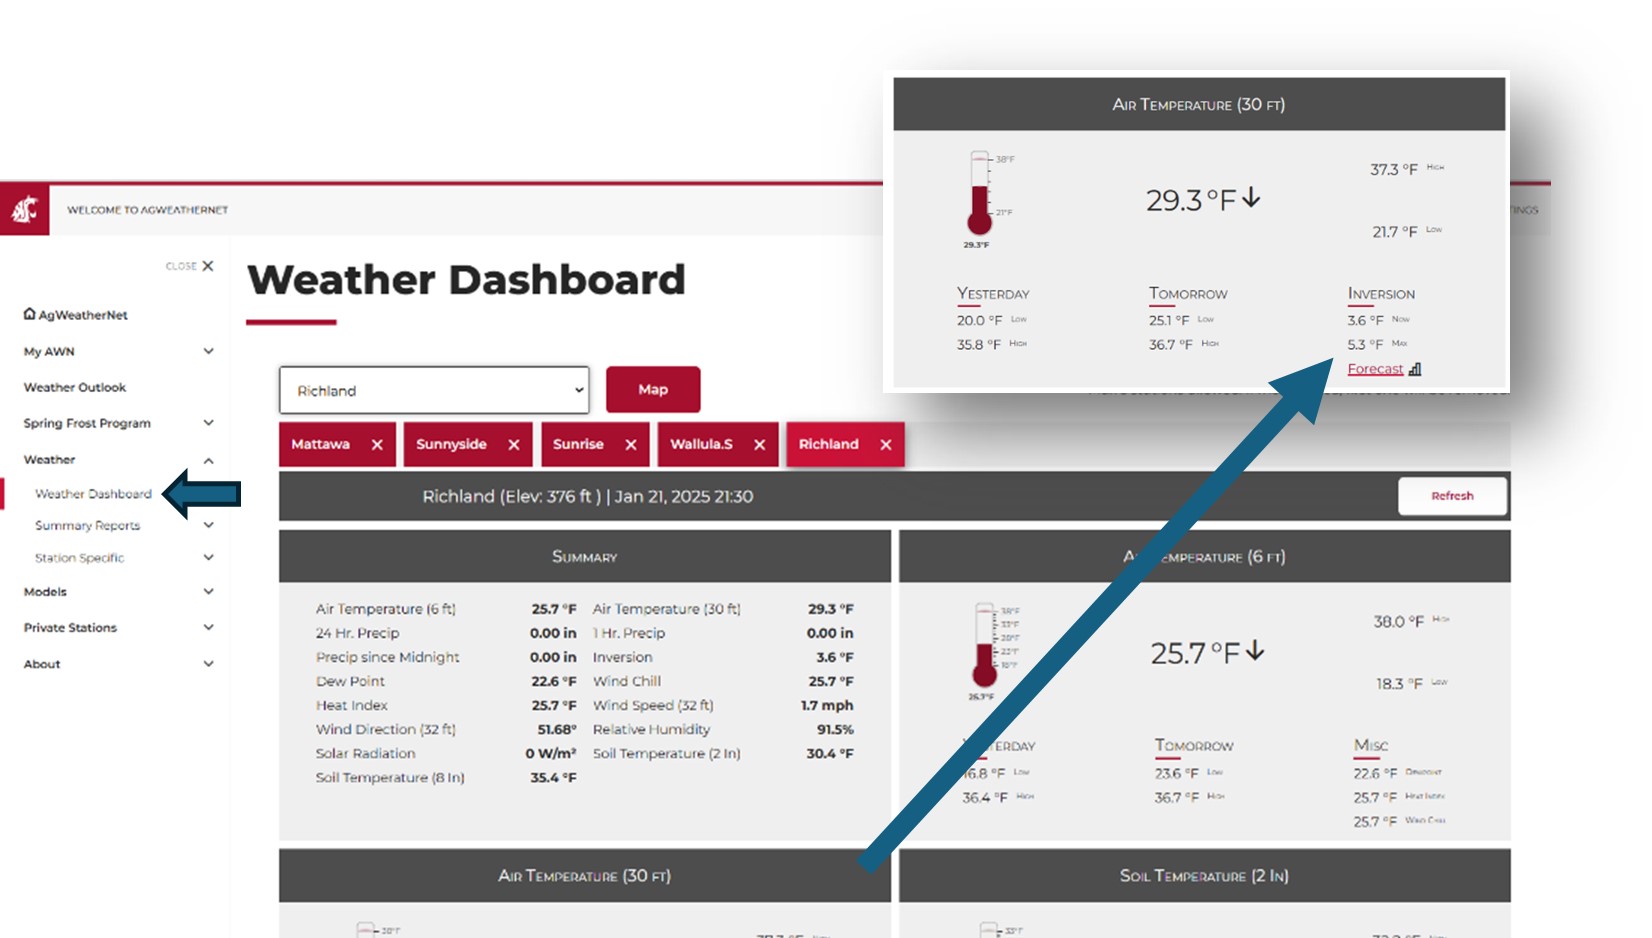
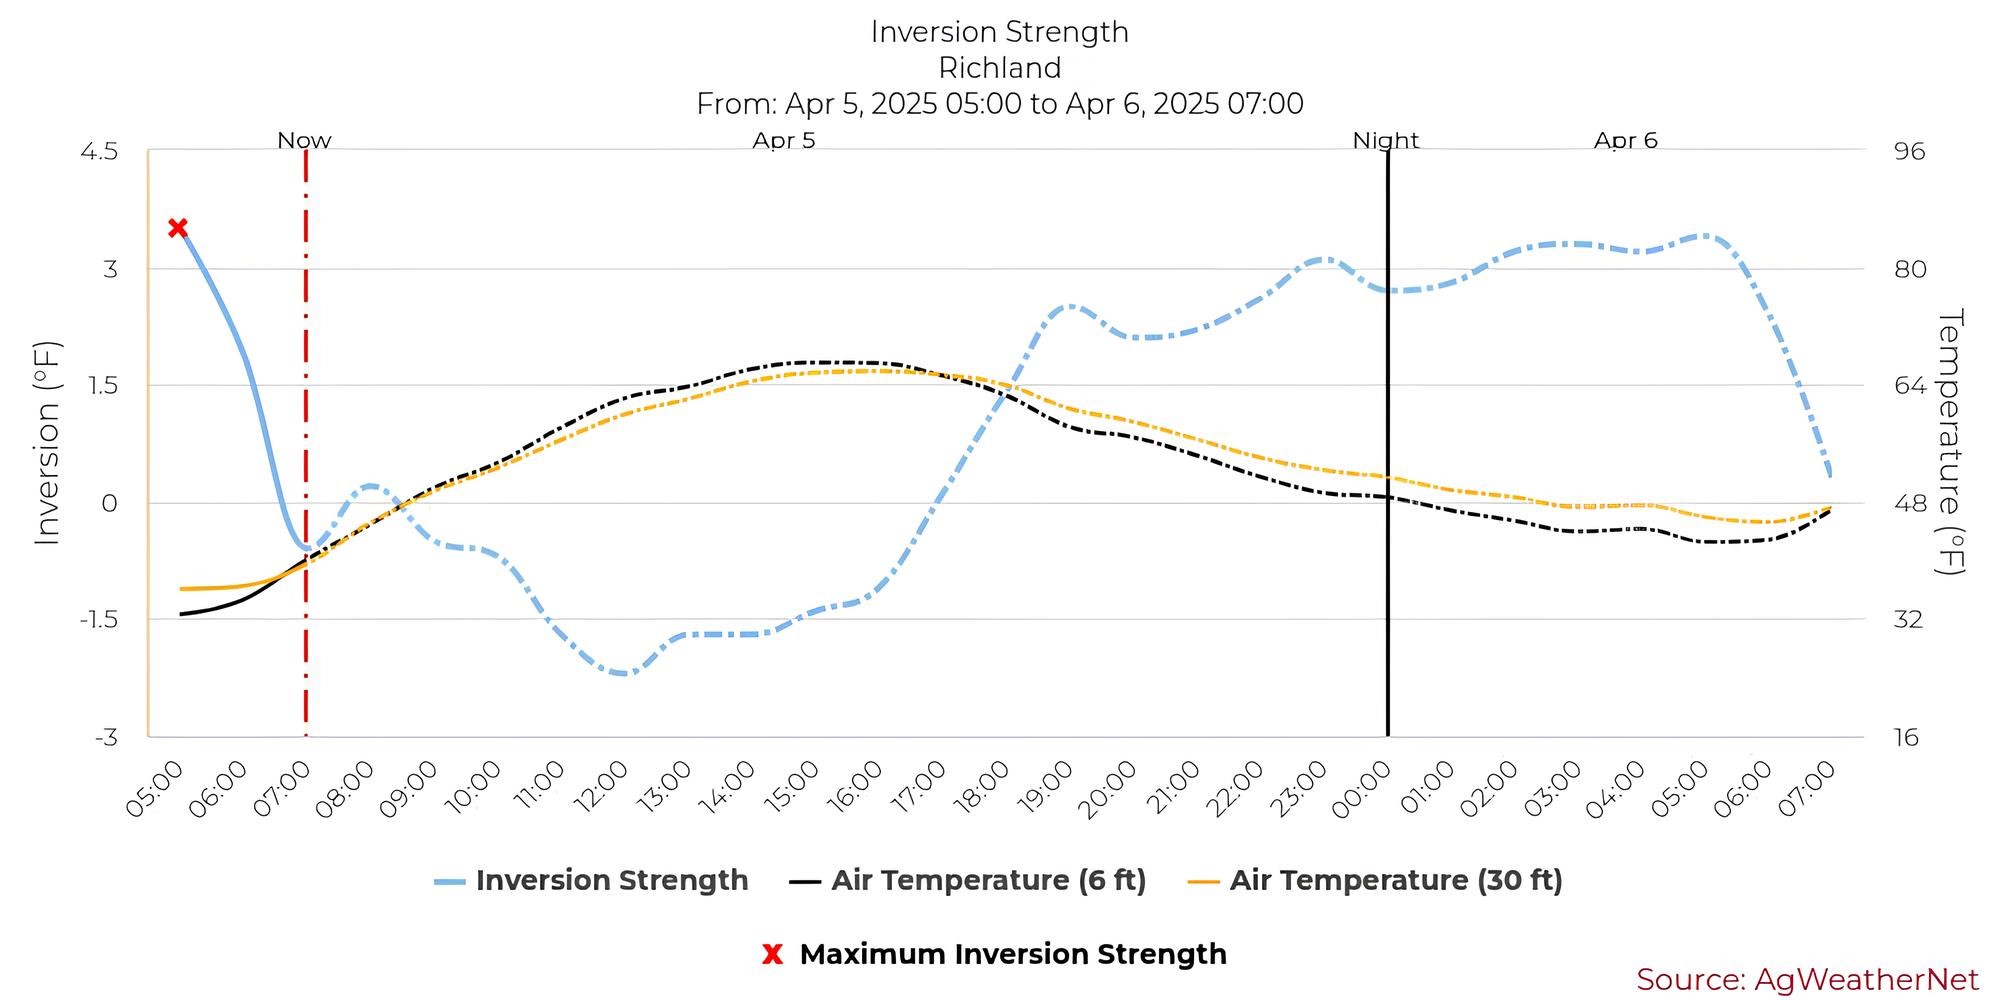
By clicking on the “Forecast” link (Fig. 4 inset), a more detailed view will appear (Fig. 5). This graph will show temperature at high elevation (30 feet) and near surface (6 feet). Warmer air must be present at higher elevation to mix the air with wind machines. If air is warmer at the surface, use of wind machines is not advised. Many fruit farms do use mid-row heaters to warm the surface air. The forecast does not account for that additional heat and the benefit it may provide in frost mitigation.
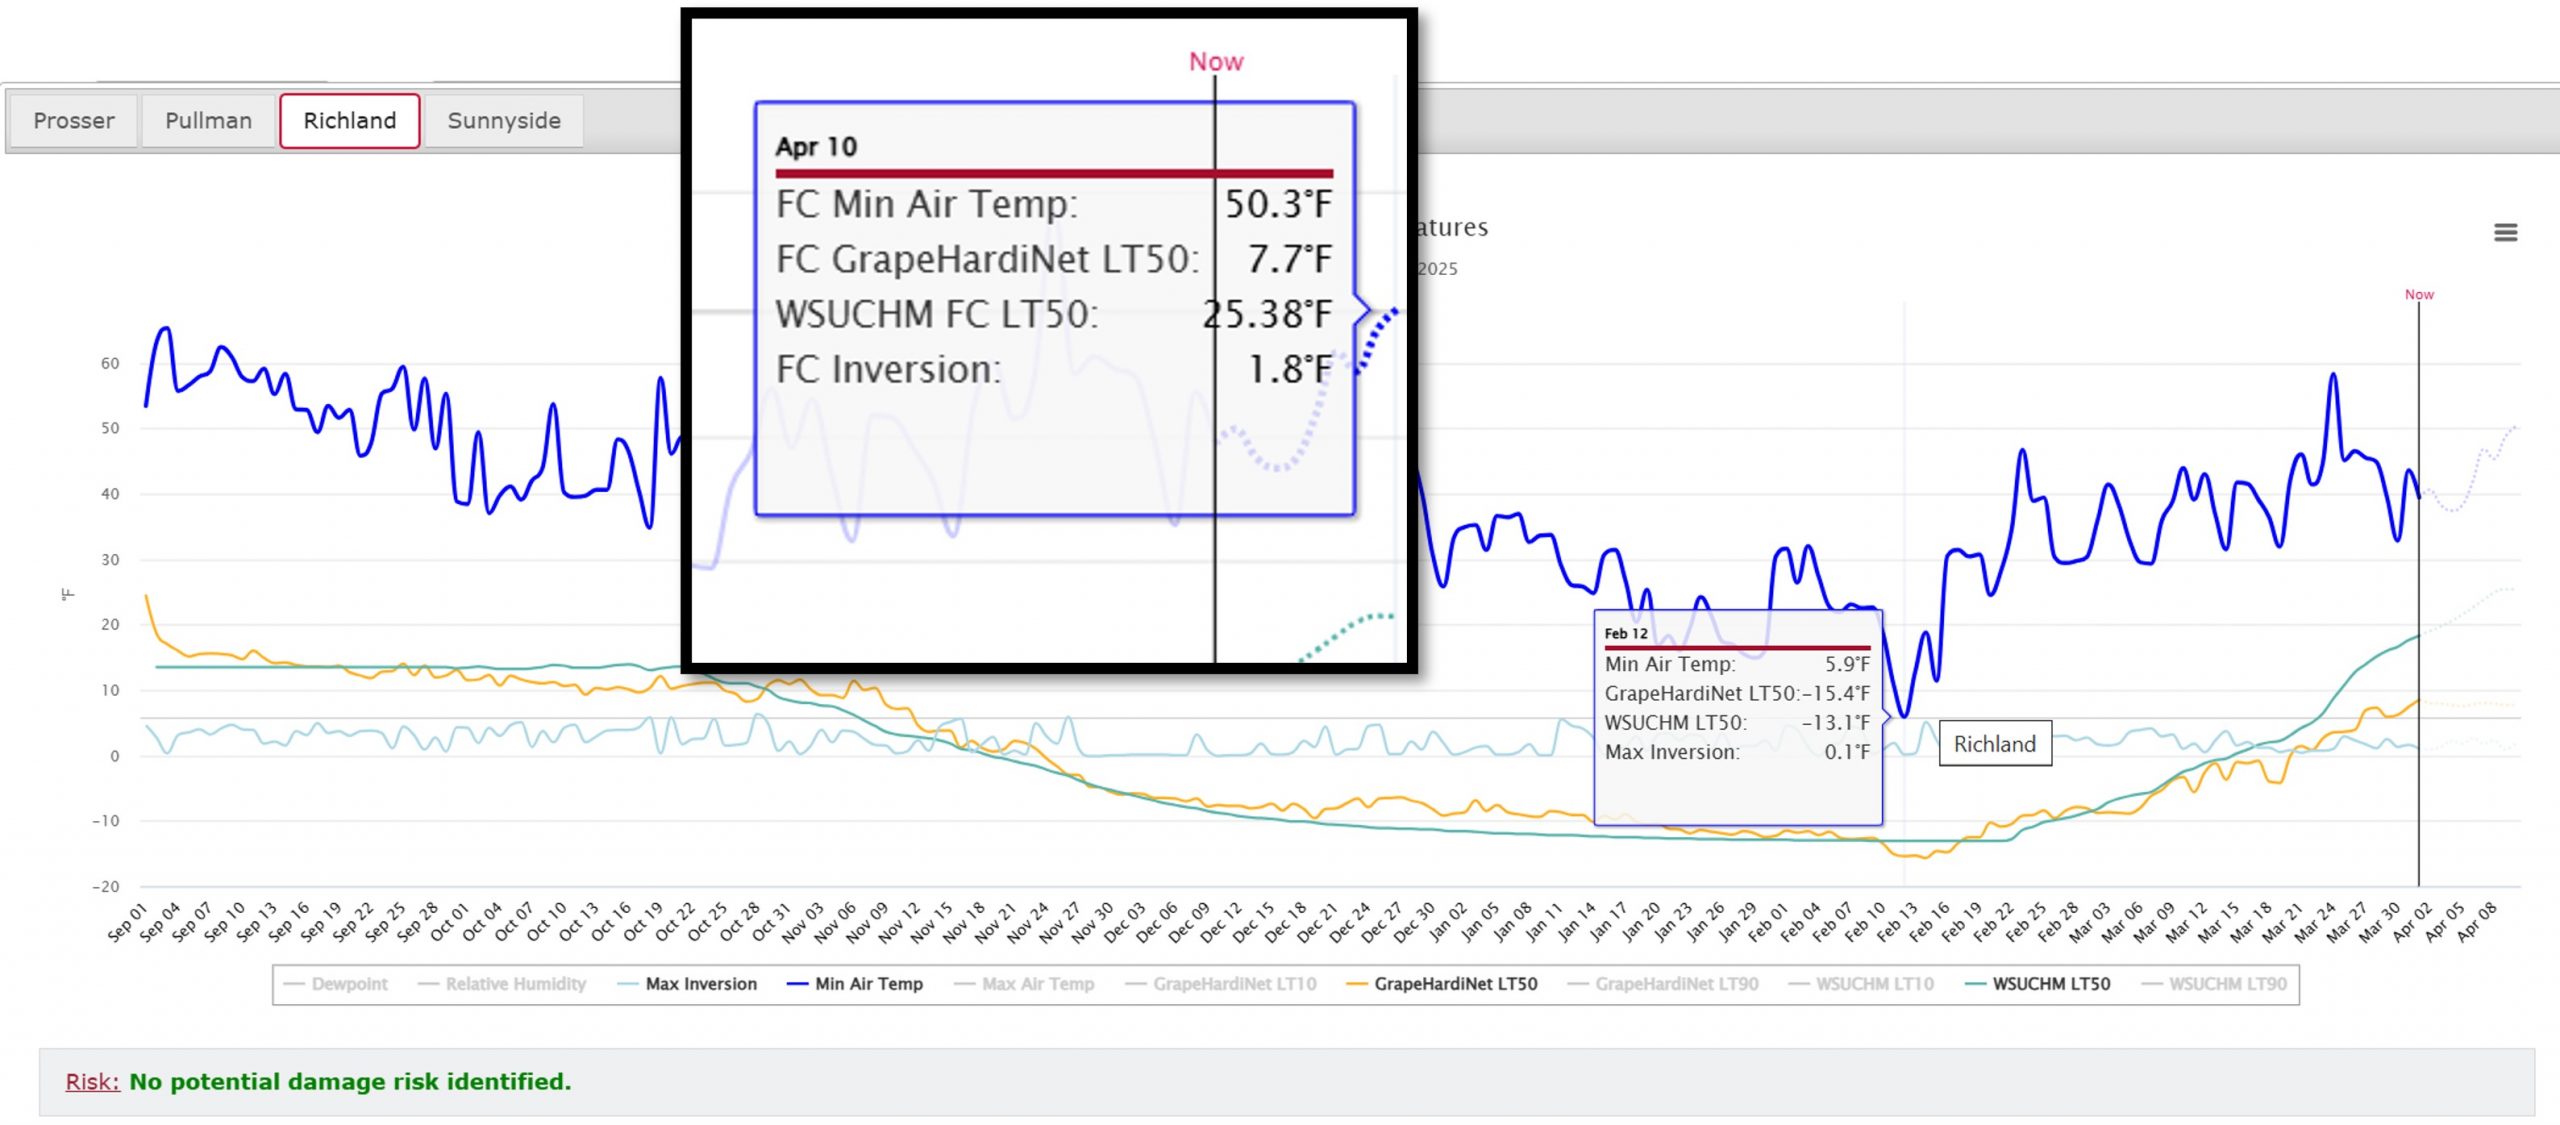
AgWeatherNet have also added these inversion forecasts to crop-specific (grape in this case) cold hardiness models (Fig. 6). This not only helps users in determining the likelihood of frost damage, but also whether operating wind machines could benefit. For example, in Richland on April 10, the forecast minimum air temperature was 50.3°F, while lethal temperature (LT50) values for grapes were 7.7°F and 25.4°F, respectively, indicating no damage risk.
Inversion strength at this station was 1.8°F and it would have been unnecessary to operate wind machine due to the absence of frost risk and close to the 2°F threshold needed for effective wind machine operation. Thus, combined view provides a practical summary for growers to make informed decisions.
Acknowledgments
This work has been supported in part by the Washington State Department of Agriculture (WSDA) Specialty Crop Block Grant, NSF / USDA NIFA Cyber-Physical Systems (Award No: 2021-67021-34336), and USDA NIFA 0745 projects.
We acknowledge prior modeling efforts by Dr. Matt Cann and model integration into the AWN web portal by Mr. Sean Hill and Mr. Aakash Shrestha.
Weather-Based Guidance for Safe Vineyard Spray Applications
Authors: Basavaraj Amogi and Lav Khot, AgWeatherNet, Washington State University Prosser
Spray guidance tool
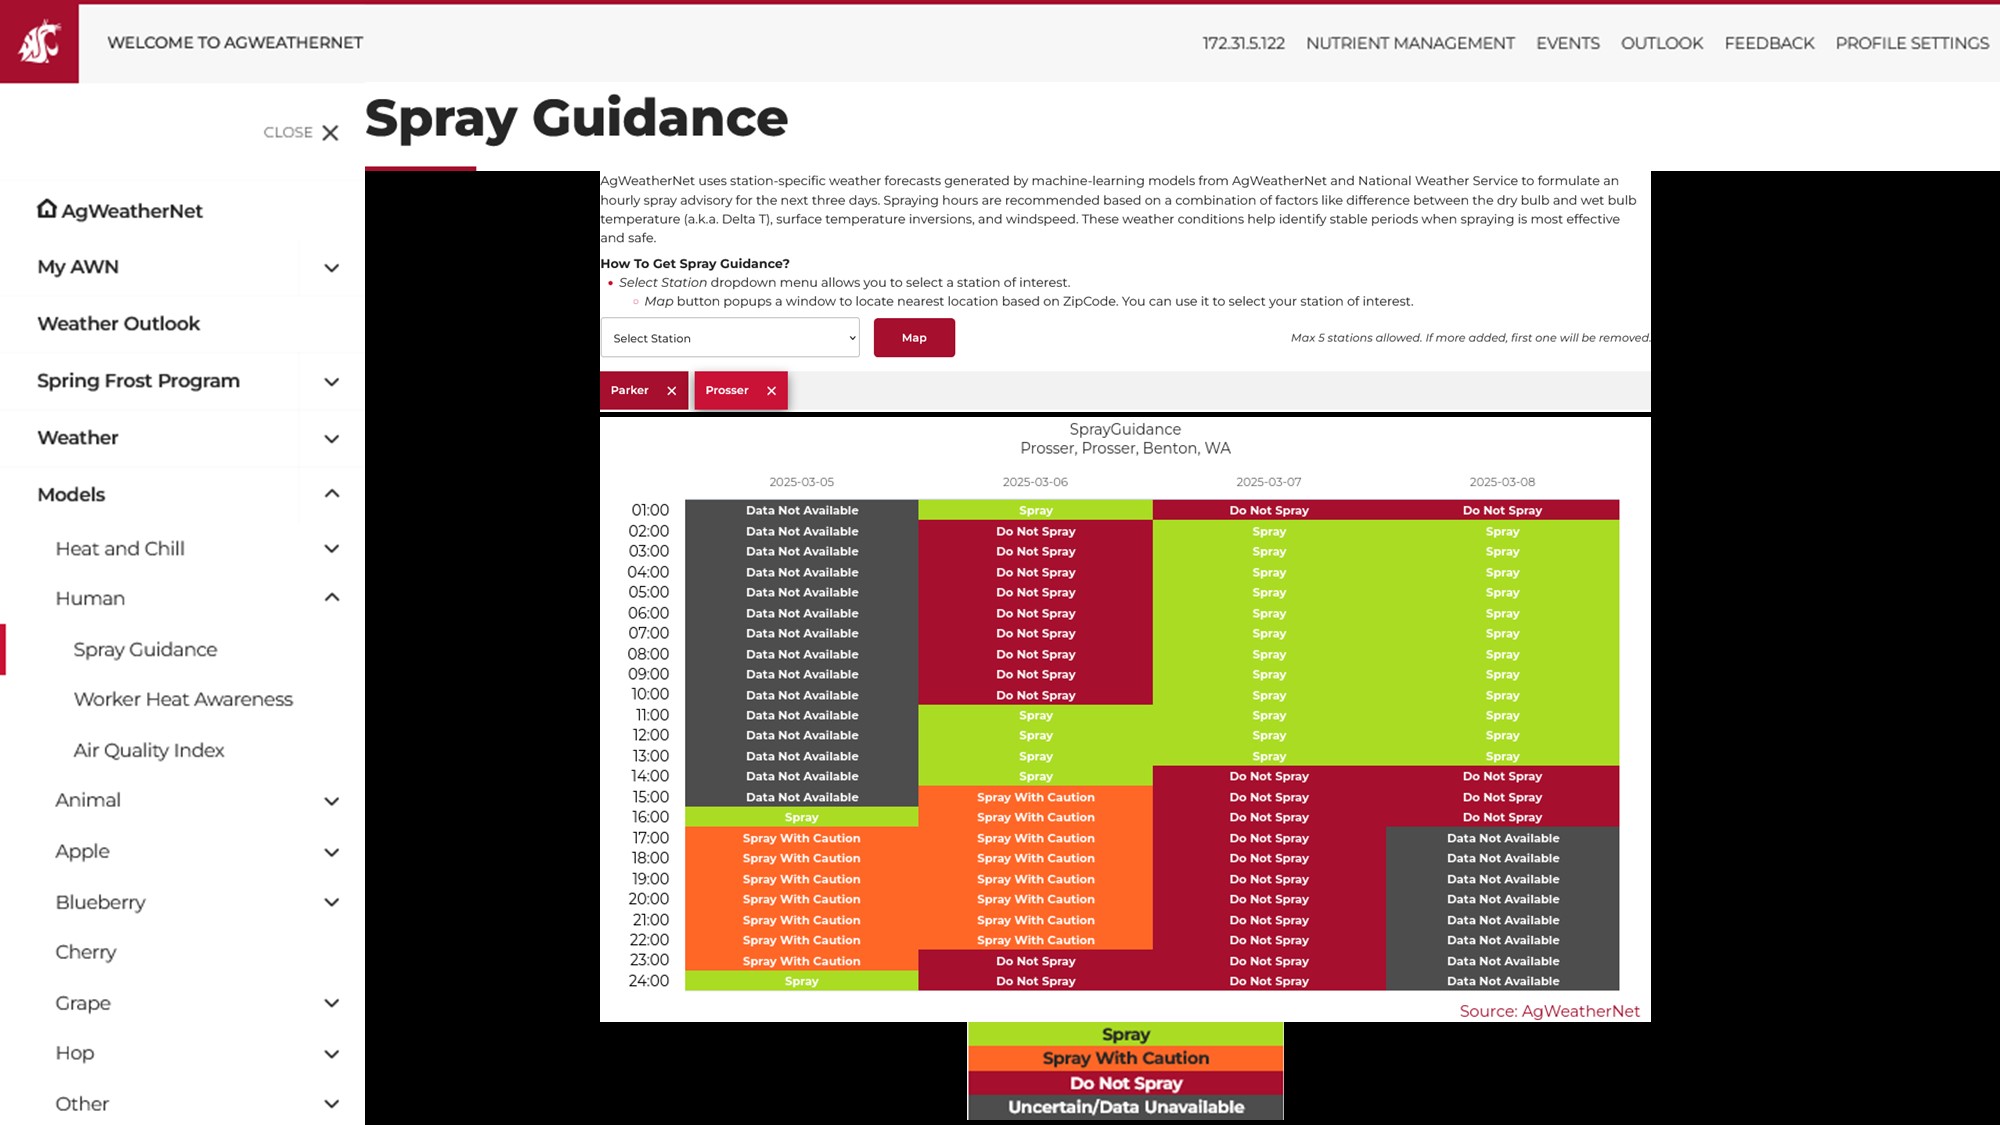
AgWeatherNet (AWN) has launched AWN Spray Guidance, a weather-guided decision support tool to help growers determine if conditions are appropriate for spraying. Using this tool, spray applicators can identify and plan to spray during the best timed-windows. The AWN Spray Guidance Tool uses real-time, station specific AWN observations as well as station specific forecasts [1].
How the tool works
The AWN Spray Guidance tool integrates observed and forecast weather data to provide an hourly spray advisory for the next 72 hours for over 360 weather stations. It classifies spraying conditions into four categories, as seen below:
- Tz > 0 °F – Don’t Spray. Temperature inversion detected; atmospheric stability is unsuitable for spraying
- Tz ≤ 0 °F ; ΔT < 0 °F or ΔT > 18 °F – Don’t spray. ΔT is outside the safe range, indicating high evaporation or condensation risk
- Tz ≤ 0 °F; 3.6 °F ≤ ΔT ≤ 14.4 °F; WS between 4 and 10 mph – Ok to spray. Conditions are optimal for minimizing drift and evaporation risks
- Tz ≤ 0 °F; ΔT between 0 – 3.6 °F or 14.4 – 18 °F; WS between 4 and 10 mph – Spray with caution. Marginally-acceptable conditions. Spraying may require adjustments to minimize risk
When-to-spray recommendations are based on a combination of factors described below:
- Temperature Inversion (Tz) is determined as the difference between air temperature measured at 30 ft and 6 ft above the ground. When cooler air is trapped below warmer air (Tz > 0 °F), spray drift risk increases, leading to a “Do Not Spray” advisory.
- Delta T (ΔT) is the difference between dry and wet bulb temperatures. It quantifies air moisture levels to predict evaporation potential of spray droplets. A ΔT between 3.6 and 14.4°F (2 to 8°C) is considered as ideal spray condition. Too high or too low ΔT results in respective evaporation or condensation risks, making spraying ineffective.
- Wind Speed (WS). The best spraying condition are when WS is between 4 and 10 mph (6.4 and 16.1 kph). Lower WS may cause inadequate dispersion, while higher WS increases drift potential of the spray droplets.
How to access
The AWN Spray Guidance tool is free to use and available online at AgWeatherNet with an AWN account. If you do not have AWN sign-in account, you can create one for free.
Once signed-in, navigate to Models >> Human >> Spray Guidance (see Fig. 1). The tool provides station-specific spray advisories for the next 72 hrs. If you have any feedback to improve this tool, write us at weather@wsu.edu
Acknowledgements
This project is an outcome of subsidiary projects funded in parts by the WSDA through the Specialty Crop Block Grant program, USDA NIFA #0745, and internal WSU AgWeatherNet funding.
Jaitun Patel and Sean Hill at AWN contributed to the tool development and delivery. We acknowledge prior modeling efforts by Dr. Matt Cann. Authors also thank AgWeatherNet staff and field meteorologists for installation and maintenance of the weather stations.
References & reading
- Cann, MD, Khot LR. 2022. https://treefruit.wsu.edu/article/ag-weathernet2/
- Tepper, G. 2022. Weather Essentials for Pesticide Application – Grower Edition.
- Stull R. 2011. J App Meteo. Climate 50: 2267–2269. https://doi.org/10.1175/jamc-d-11-0143.1
- Amogi B, et al. 2025. Localized weather forecast guided spray application advisory webtool for the Pacific Northwest US. Proc. 15th Euro Con Prec Ag., Barcelona, Spain.
AWN Smart Farm: Private Sensing Networks for Vineyards
Authors: Srikanth Gorthi and Lav Khot, AgWeatherNet, Washington State University
WSU AgWeatherNet (AWN) can now seamlessly integrate and support private sensor networks.
This advancement will empower growers to implement tailored, cost-effective sensing solutions for monitoring weather, plant health, and soil conditions within their farms. By connecting these customized networks to AWN, growers can gain access to real-time, high-quality data for informed on-farm decision making; this effectively creates an AWN-powered Smart Farm system.
The AWN Tier-3 program
WSU AWN currently allows growers to add private weather stations into the AWN platform (see: AWN Tier-3 Stations). AWN does real-time data pull from these stations (at 15-min intervals), data quality checks, and alerts growers about any data issues. These stations are also tied to the decision support tools available within AWN and the WSU Decision Aid System (DAS).
Using this same platform, growers can now integrate their preferred agricultural sensors into AWN’s broader open-field weather monitoring network. This will enable improved decision making related to management of things such as frost damage, heat stress, and irrigation. An added bonus: As private sensing networks are driven by Long Range Wide Area Network (LoRaWAN, detailed in next section), it reduces overall data collection costs, compared to existing subscription-driven solutions. Additional benefits of AWN’s approach include scalability, long-term and secure data storage, and data privacy.
Private sensing network
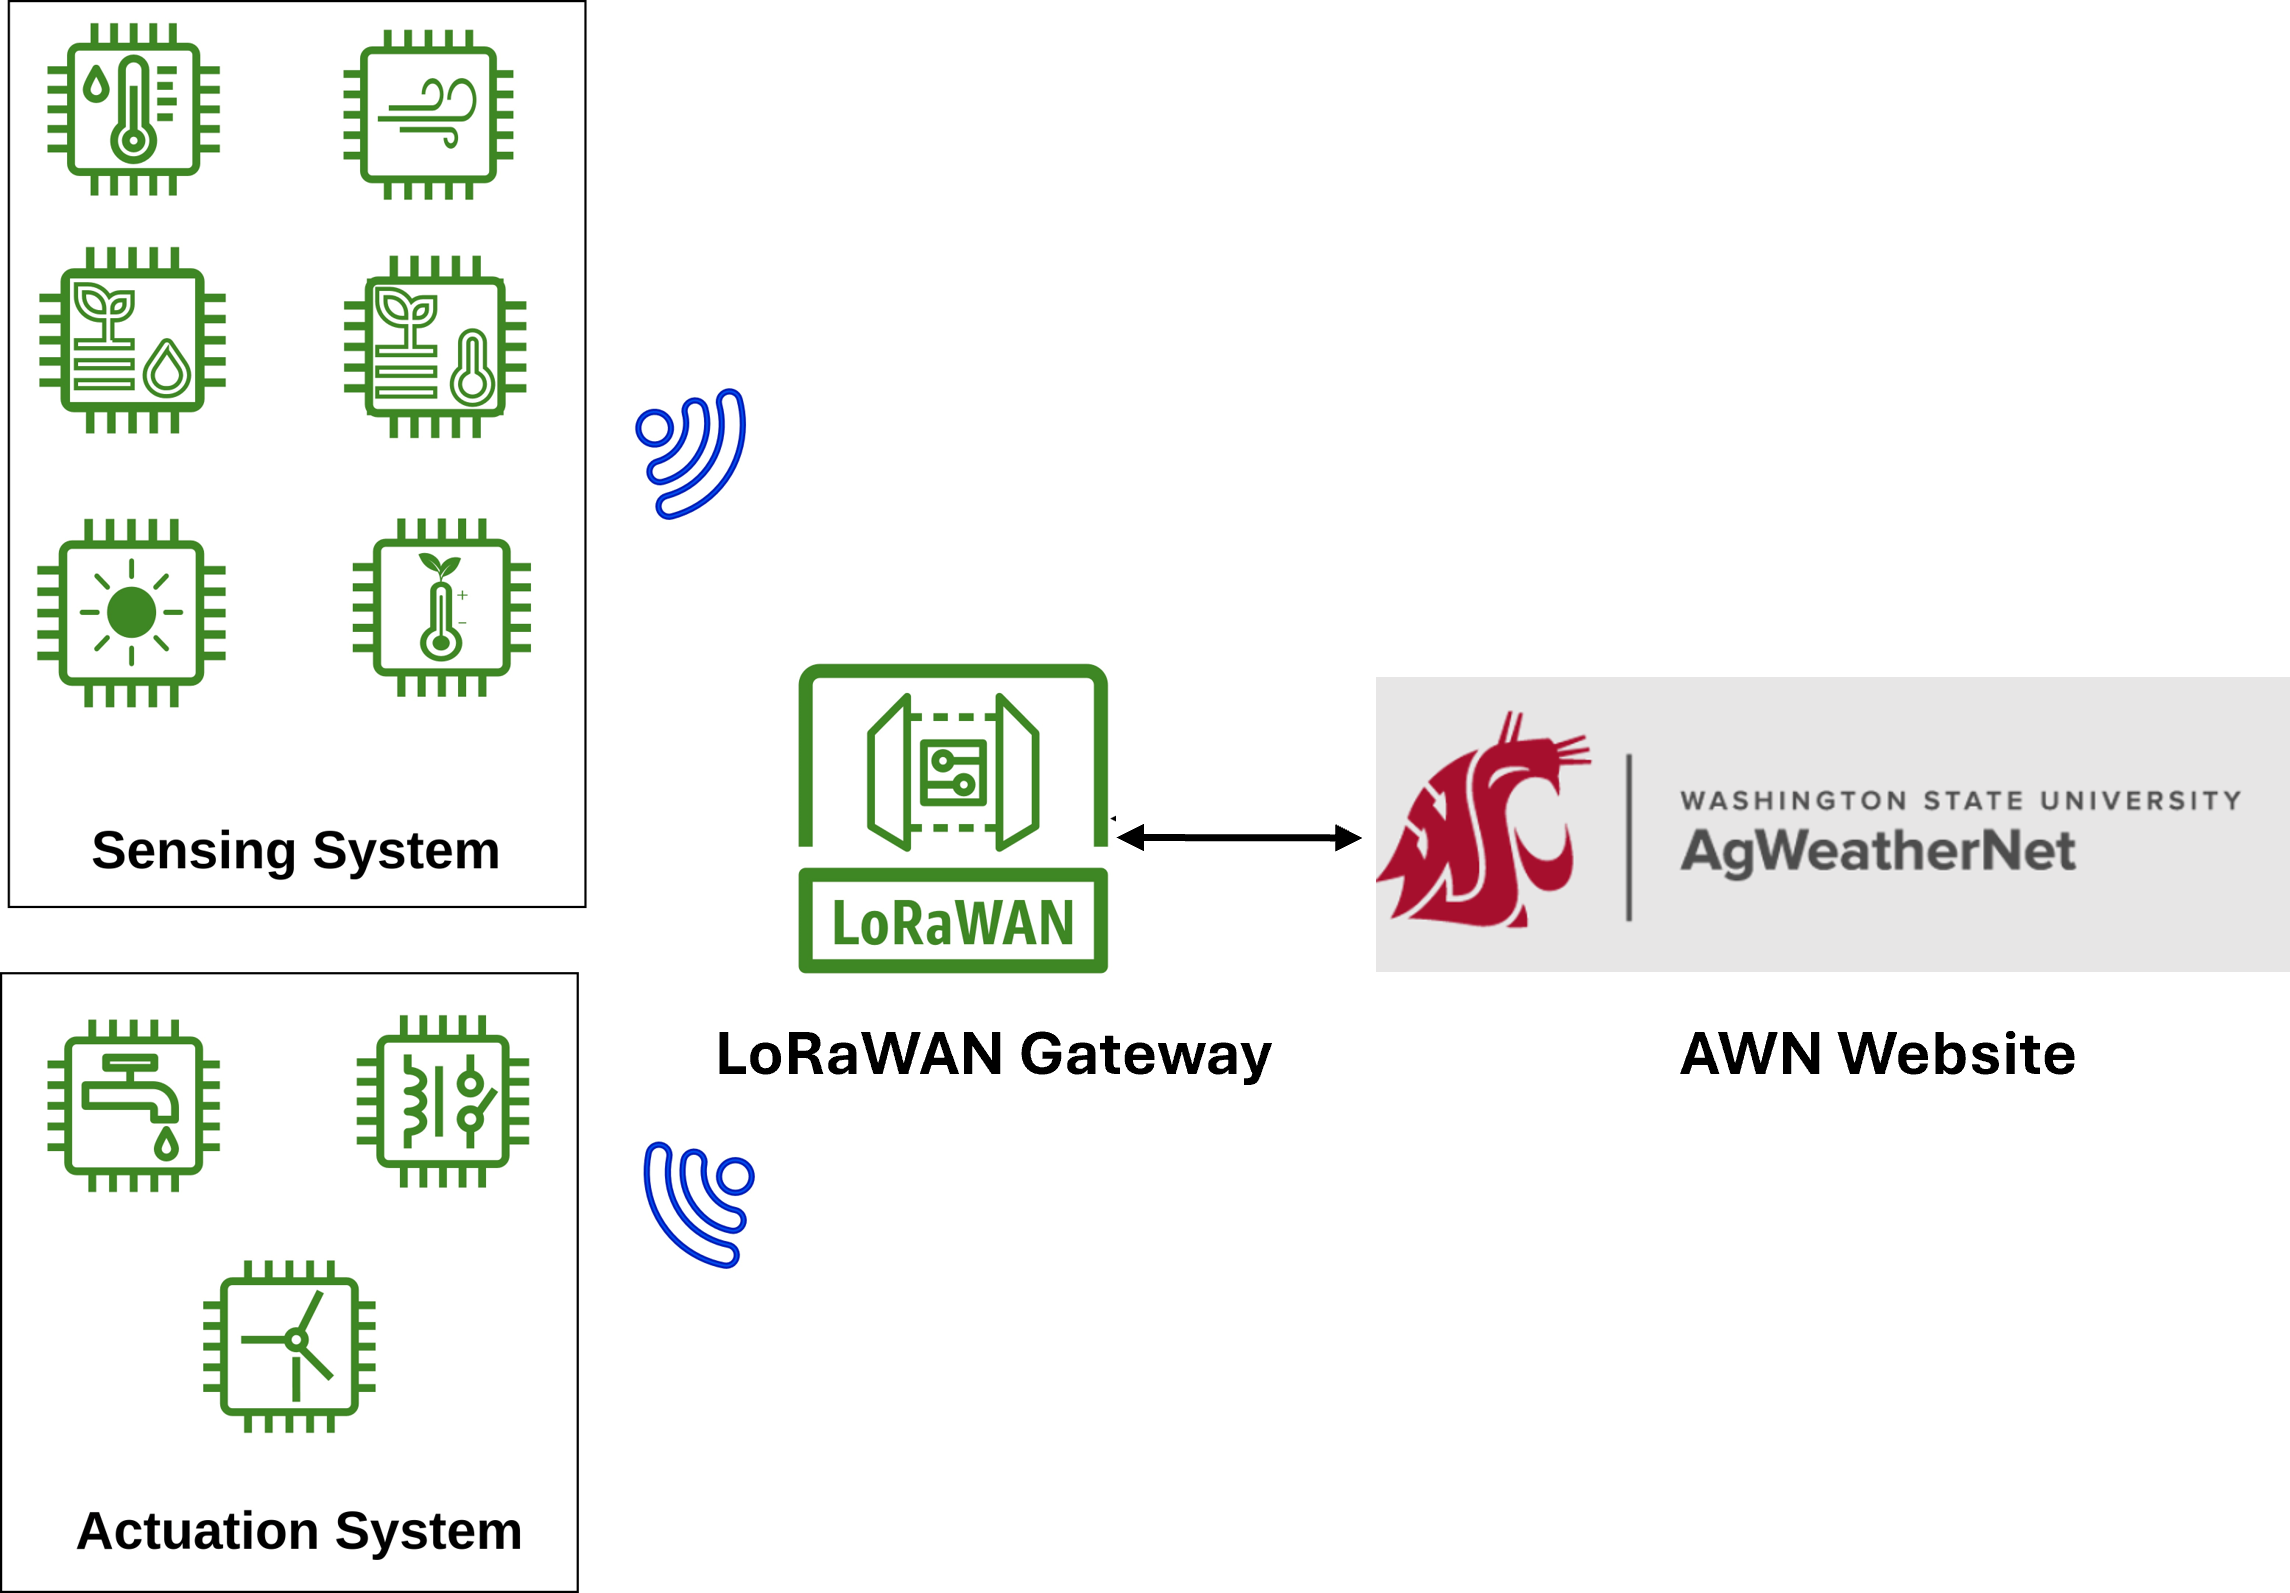
The AWN Private Sensing Network, (AWN Smart Farm), will primarily focus on integrating LoRaWAN-compatible sensors. LoRaWAN-compatible sensors are well-suited for agricultural applications due to their low-bandwidth long-range communication capability – up to 10 miles between sensor node(s) and gateway, low power consumption, and minimal maintenance costs [1].
Examples of such sensors include S31-LB/LS, D20/D20S-LB, SE0X-LB, SenseCAP S2120, SenseCAP S2101, RAKWireless RAK1901. In addition, sensors that communicate using the serial data interface (SDI-12) can also be integrated into LoRaWAN via compatible dataloggers. Common SDI-12 sensors include the ATMOS-14, TEROS-12, Florapulse SWP, LI-710 and can be connected to LoRaWAN dataloggers (nodes) such as Dragino SDI-12.
How do these sensors work? Each individual sensor (node) transmits the data to a field-deployed gateway installed by the farm (located within a 10 miles radius). The gateway serves as a communication bridge, via an onsite Wi-Fi or cellular connection, to the AWN cloud (Fig. 1). To ensure wide and reliable coverage, gateway antennas should be installed at elevated locations, such as on the roof of equipment storage sheds, to avoid obstructions. AWN is currently conducting a comprehensive study to evaluate various sensors for their accuracy, and compatibility, as well as the robustness and reliability of gateways in terms of data collection and transmission.
A private sensing network not only helps with agriculture monitoring but also powers automation. Using sensor inputs and predefined thresholds or models, triggers can be sent to actuate evaporative cooling systems, irrigation, or wind machines, just to name a few applications.
AWN Smart Farm Dashboard
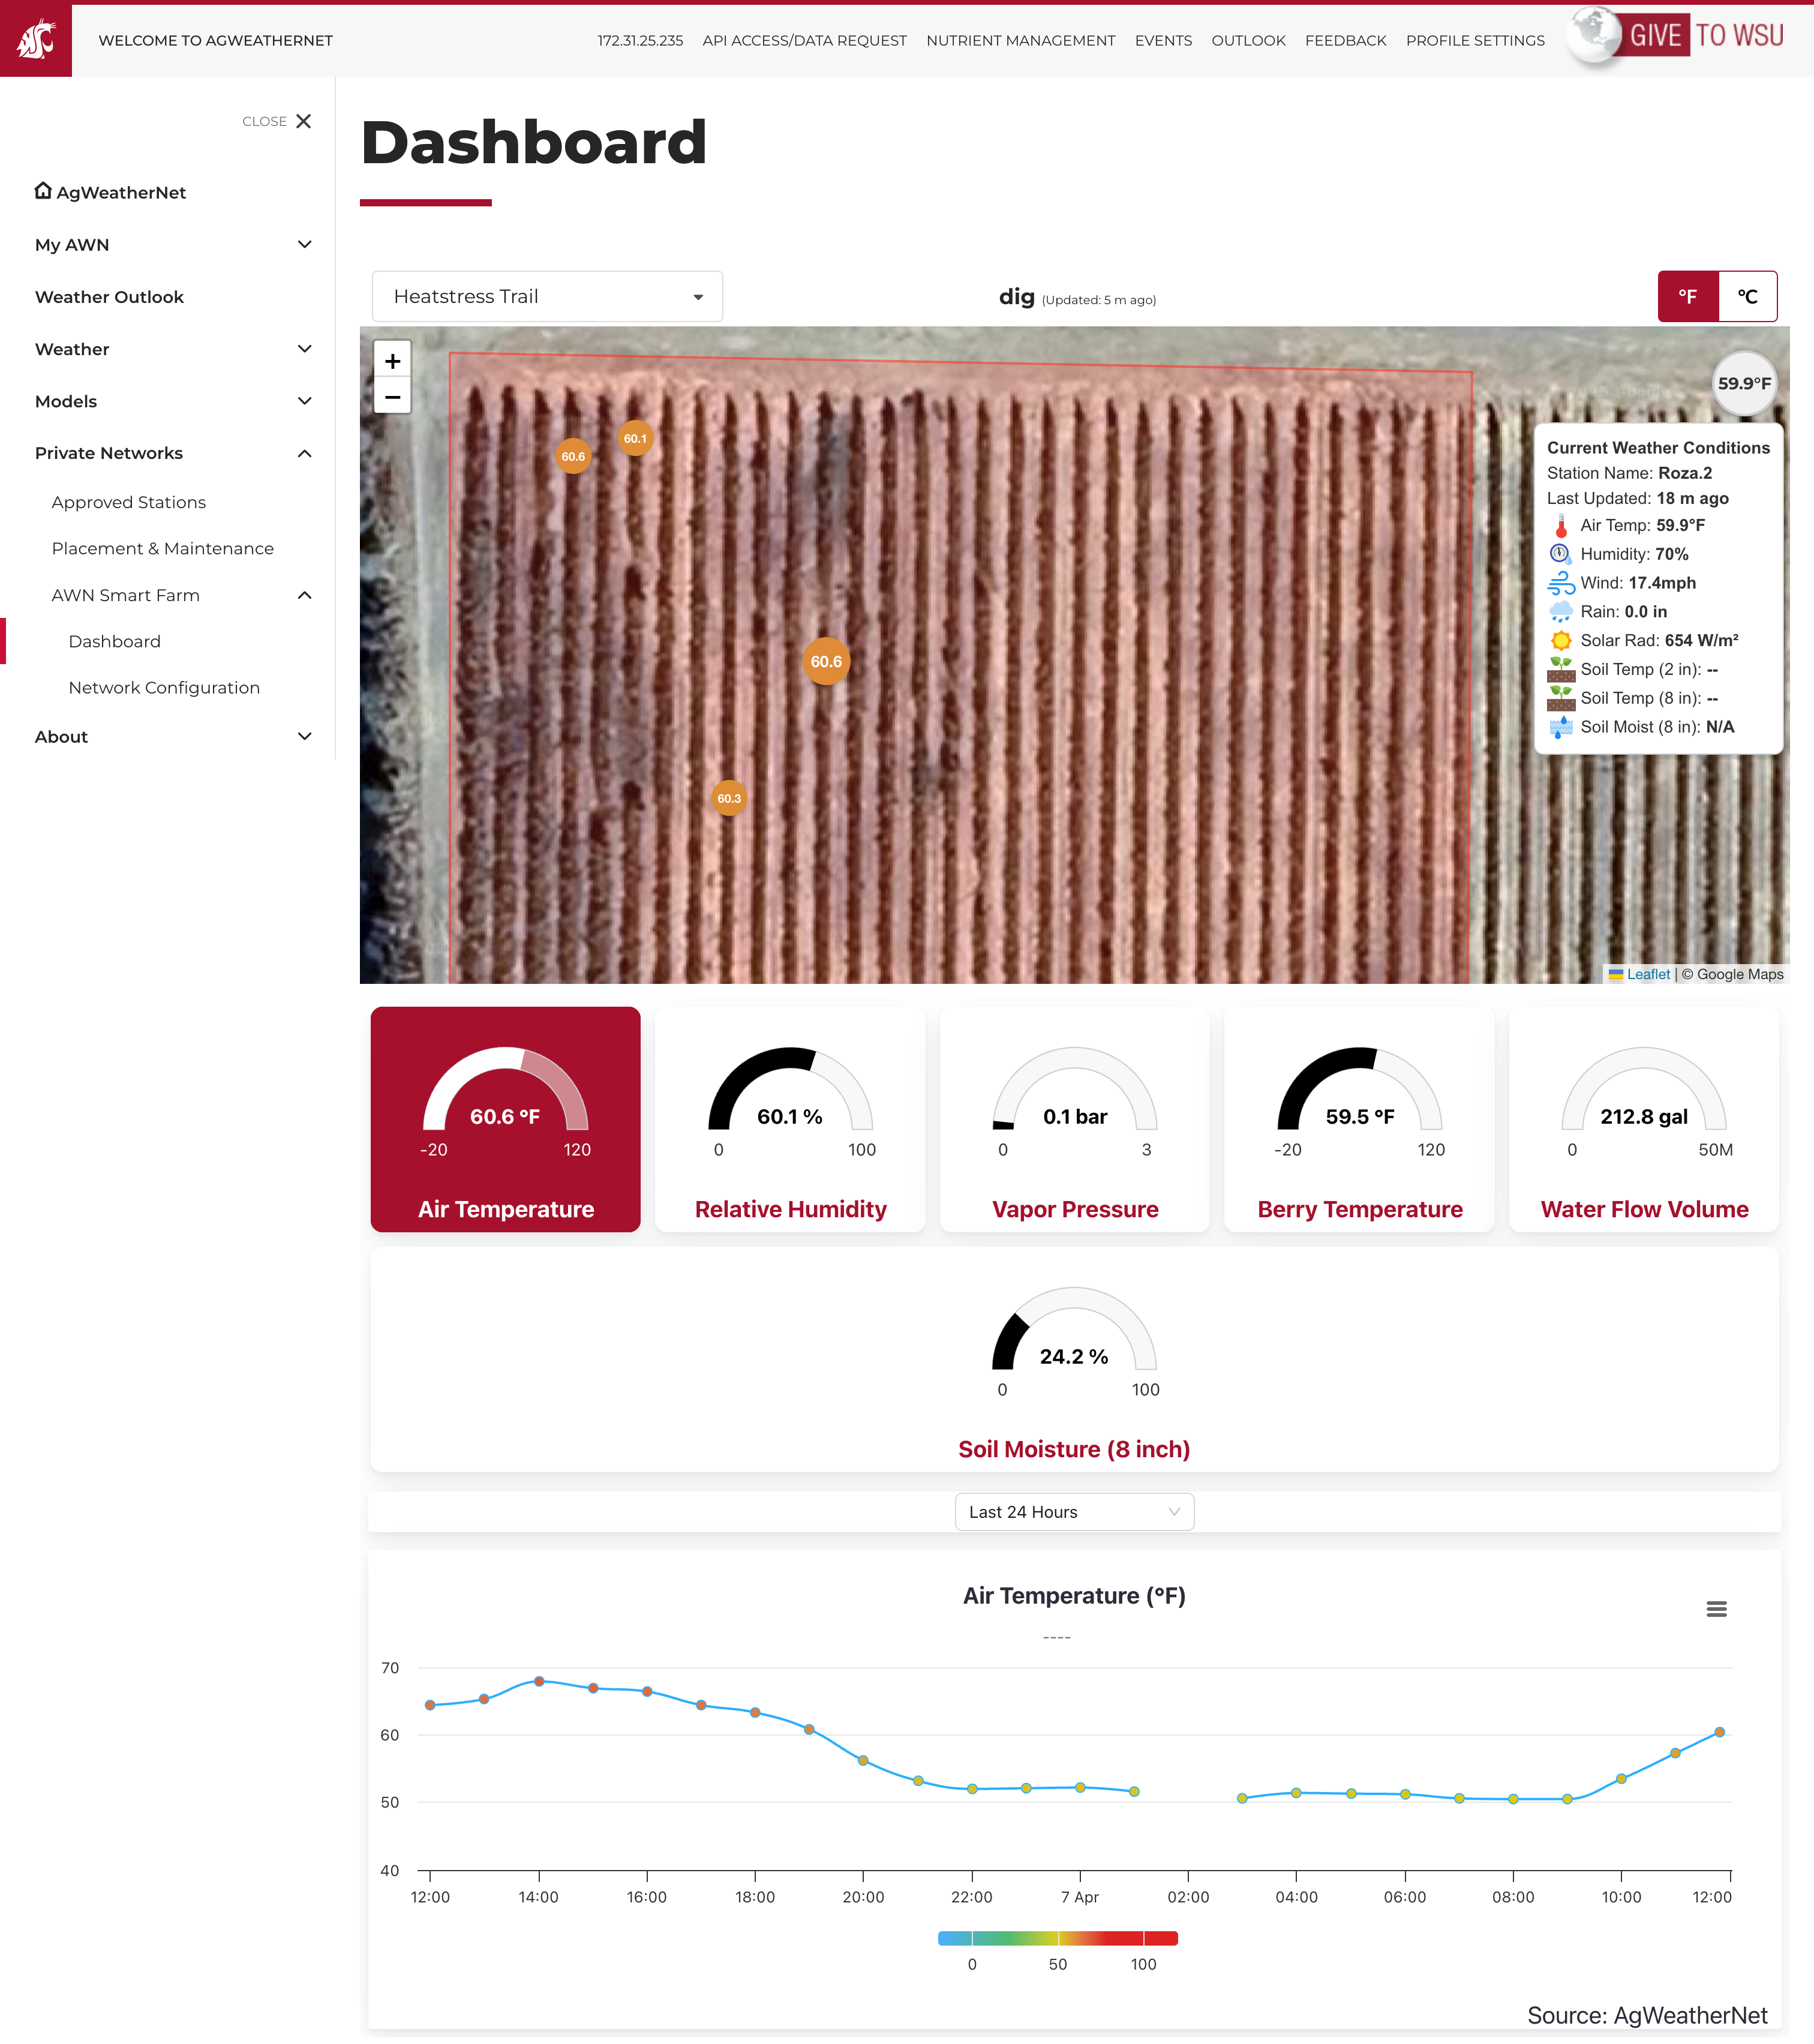
The AWN Smart Farm Dashboard delivers real-time data from each of the private sensing networks. The dashboard provides data insights for individual farm block(s). This data is only accessible to specific user(s), and at varied administrative / access levels, defined by the owner of the private sensing network. Figure 2 illustrates an example of a private sensing network deployed in a vineyard block for automated heat stress mitigation. In this deployment, data from air temperature, humidity, and berry temperature (measured using thermistor inserts into berries), soil moisture, and leaf wetness sensors as well as water flow meters, are collected and pushed to the dashboard at a 5-min interval. In addition to in-field sensor data, the dashboard renders data from the nearest (grower-selected) AWN open-field weather station. Growers can also use open-field weather station data in identifying anomalies within the private sensing network or vice versa. For this specific vineyard, the private sensing network enables an accurate assessment of heat events and provides data to support decisions to proactively manage heat stress (such as altered irrigation strategies or evaporative cooling use). Similar networks have been deployed in commercial sweet cherry orchards to monitor frost conditions to proactively manage potential bud damage [2].
Use cases and future
In addition to the vineyard and orchard described above, AWN has deployed pilot private sensing networks in:
- A commercial blueberry block
- DEMO Smart Vineyard (WSU Prosser IAREC
- WSU Smart Apple Orchard.
Frost (blueberry), heat stress (apple) and deficit irrigation (grapes) are monitored using localized sensor inputs. Other measurements include soil moisture, air temperature, and overall block-specific water use through compatible flow meters.
In the future, the AWN Smart Farm Dashboard will be customized to visualize crop phenology, crop-specific decision support models (e.g., cold hardiness, heat stress), and weather-guided optimal spray-time windows for drift mitigation. As research progresses, AWN will also integrate localized “nowcasts” for enhancing advanced warning capability for block-specific management.
If you want to add a private sensor network to AWN or have feedback, please email: weather@wsu.edu.
Acknowledgments
This article has been modified from its original publication in Washington State Tree Fruit Extension Fruit Matters.2 This product is an outcome of PhD dissertation work done by Srikanth Gorthi (Advisor: Lav Khot) and was supported in parts by NSF/USDA NIFA Cyber-Physical Systems (Award Nos: 2021-67021-34336, 2021-67021-35344 [AgAID Institute]), USDA NIFA 0745 projects, and AWS Cloud Credit for Research. We also want to acknowledge Sean Hill and Sanjita Bhavirisetty at AgWeatherNet for their help in porting, scaling, and improving the AWN web platform. The authors also thank Dr. Markus Keller, Dr. R. Troy Peters, Prof. Gwen-Alyn Hoheisel, Associate Prof. Bernardita Sallato, Mr. Shafik Kiraga, Dr. Jake Schrader, and Mr. Dattatray Bhalekar, who are collaborating on some of the use-case explorations.
Additional Reading
- Pagano A. et al. 2023. A Survey on LoRa for Smart Agriculture: Current Trends and Future Perspectives. IEEE Internet of Things Journal, 10 (4), 3664–3679. https://doi.org/10.1109/jiot.2022.3230505
- Gorthi et al 2025 AWN Smart Farms: Private Sensing Networks for Site-Specific Orchard Management. WSU Fruit Matters. April 2025.
Weed Control Options in Vineyards – Chemical and Non-Chemical
Author: Rui Liu, WSU Prosser IAREC
Weeds compete with grapevines for growth resources such as water, nutrients, and sunlight. They interfere with irrigation, host pathogens and insects, and can be a problem for harvesting procedures and other vineyard operations. Weeds also compete with cover crops and affect the aesthetics of vineyards. For these reasons, effective management options are needed to control problematic weeds, such as puncturevine (Tribulus terrestris), field bindweed (Convolvuls arvensis), barnyardgrass (Echinochloa crus-galli), and bermudagrass (Cynodon dactylon).
Herbicides
Herbicides are great tools for managing weeds. Soil-applied pre-emergence (PRE) herbicides can be used during the winter dormant season or early spring for residual weed control. Natural rainfall during those times of the year can help activate PRE herbicides. Post-emergence (POST) herbicides can be used after weed emergence.
However, in addition to the limited chemical herbicide options available for use in vineyards, weeds can develop resistance to these herbicides, which makes them more difficult to control.
Finally, herbicide use has been the focal point of environmental and consumer health concerns, as well as regulatory restrictions on exported goods. This suggests that non-chemical alternative options are needed.
Non-chemical weed control alternatives
Alternative non-chemical weed management strategies are in high demand for vineyards. Undervine mowing and cultivation are two widely used options by area grape growers.
Non-chemical management options have also expanded in recent years, when electrical weeding devices were designed and commercialized. The idea of using electricity to control weeds was first explored in the 1890s. Electric currents go through weeds and generate heat, causing the water in the plant cells to vaporize. This process kills weeds by bursting the plant tissues and overheating the plant from the inside out (Fig.1).
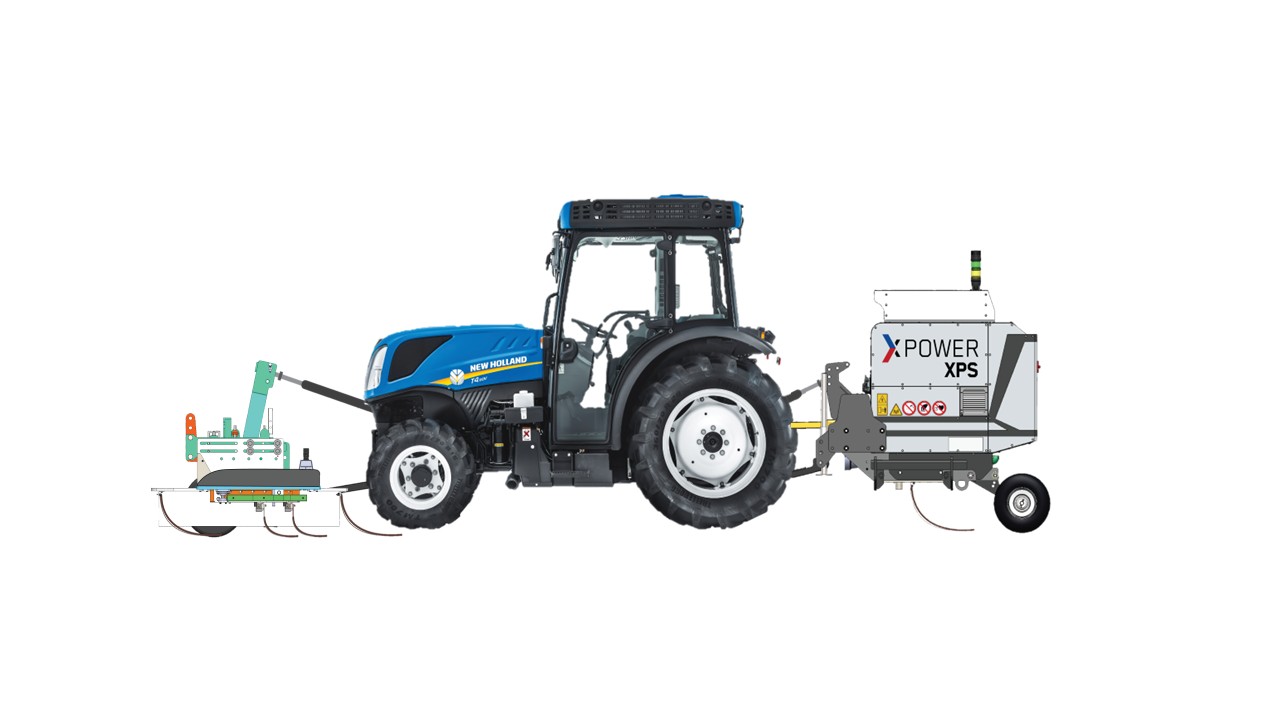
ZassoTM is one company that has developed an electrical weeder for agriculture use (Fig. 2). There is a model that is designed to be used in perennial crops, including vineyards (https://zasso.com/portfolio/xps/). This equipment converts the mechanical power the tractor generates to electrical power through a PTO generator mounted on the tractor. The low voltage currents are transformed into high voltage currents and pass through plants on the surface, and then to their roots, to complete the electrical circuit.
A WSU Trial – Electrical and mowing weed management
In summer 2024, we conducted a study to compare different non-chemical weed management options in an established vineyard where no undervine herbicides have been used for a number of years. The trial was conducted on an experimental vineyard at Washington State University Irrigated Agricultural Research and Extension Center, Prosser, WA.
The under-vine treatments included:
- Cultivation
- Undervine mowing once in a season in April
- Undervine mowing twice in the season in April and June
- Electrical weeding once in the season in April
- Electrical weeding twice in the season in April and June
- No weed management
Each treatment plot consisted of six consecutive grapevines, and treatments were distributed in a Randomized Complete Block Design, with four replications. The major weed species present in the vineyard were grass species.
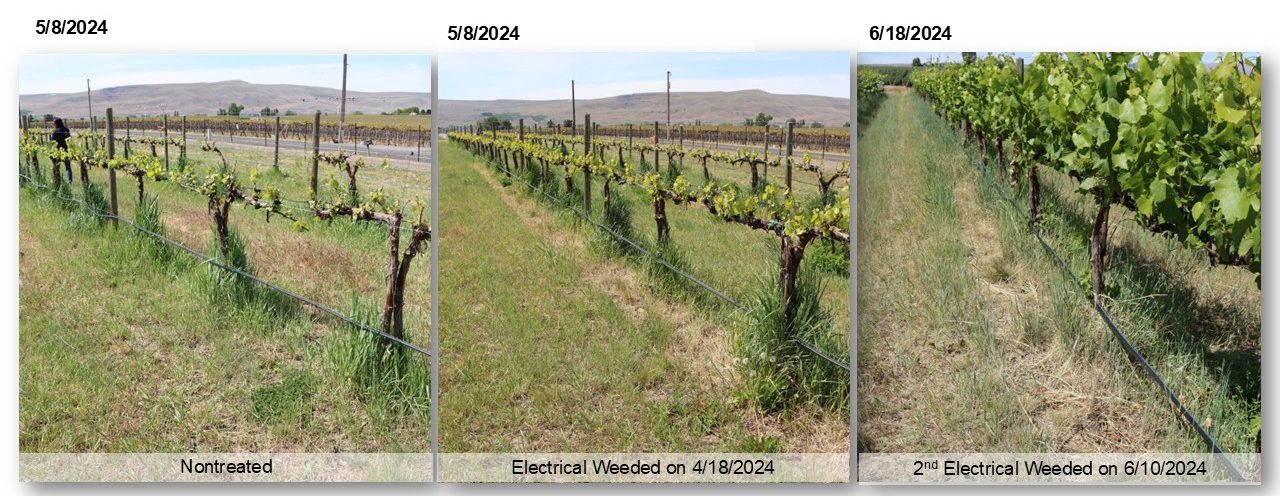
First year results, rated in August showed that electrical weeding twice in the season provided the best weed control (>85%, Fig. 3), in comparison to cultivation and undervine mowing treatments (60 to 75% control, relative to unmanaged vines).
A WSU Trial – Chemical weed management
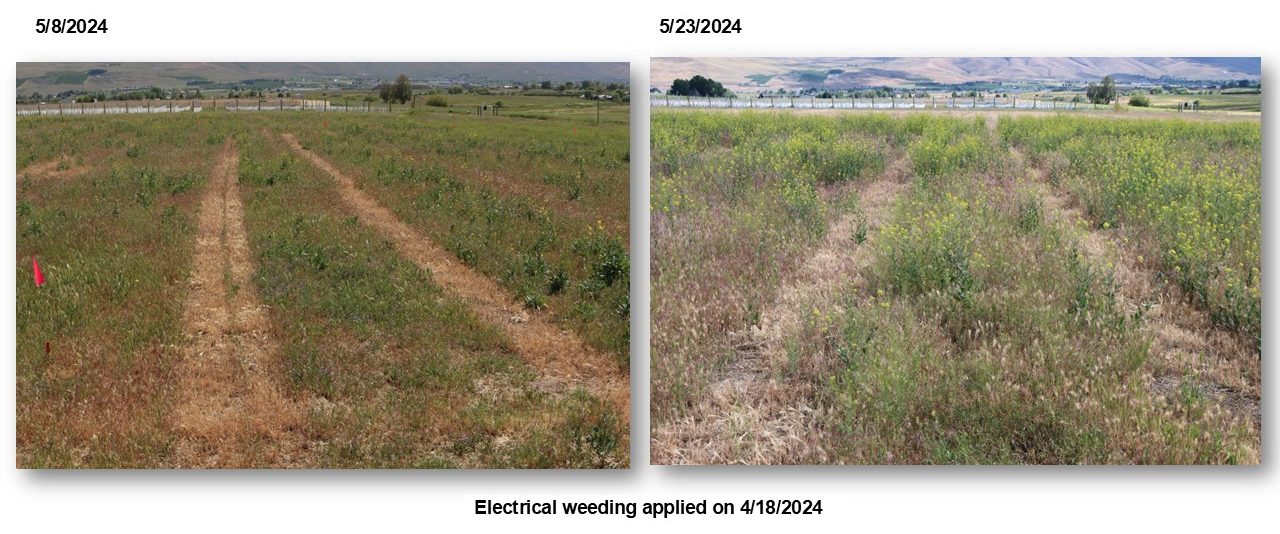
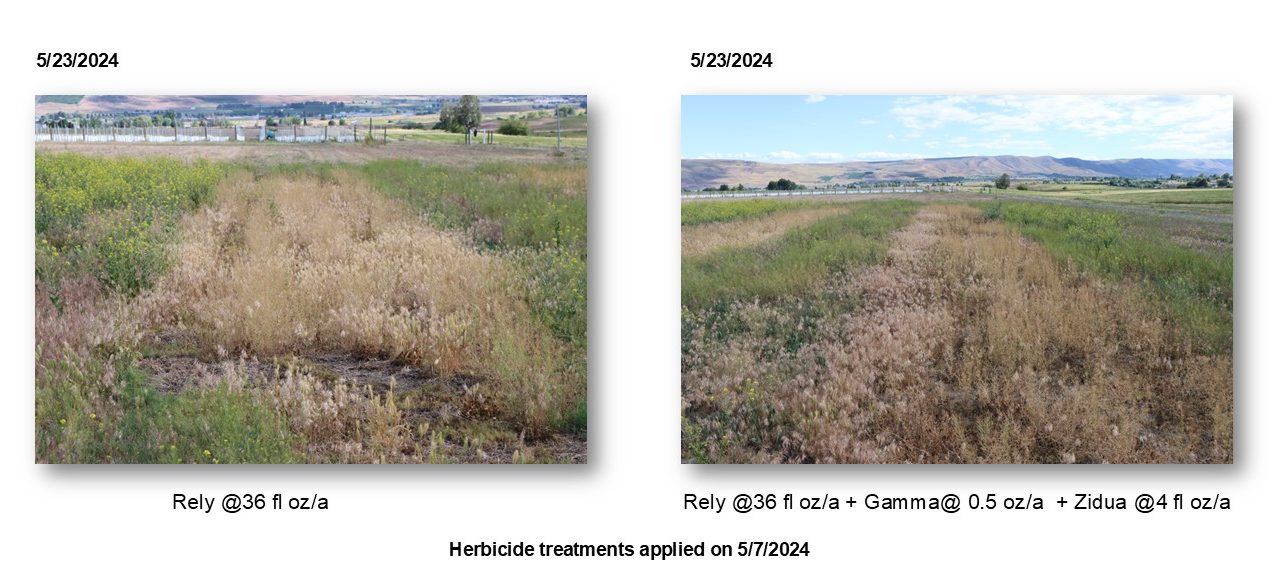
In an adjacent fallow field, we also compared the non-chemical treatments with herbicide treatments, in a strip-plot design. Each plot was 20 ft. by 30 ft. Herbicide treatments in early May included Rely (36 fl. oz/acre, POST applied), Rely (36 fl. oz/acre) + Gamma (0.5 oz/acre) + Zidua (4 fl. oz/acre) (PRE+POST applied). Results indicated electrical weeding twice in the season provided similar control to herbicide treatments (Figs. 4, 5).
Conclusion
There are still questions that need to be answered for electrical weeding technology, for example, the best timing for application, optimum speed, fire hazard concerns, etc. The recommended application conditions for this technology to achieve the best weed control results include when weeds are small and have high water content. It works well with weeds with small and easy root systems, such as broadleaf weeds. Tractor driving speed is slower, and topsoil moisture is low, with medium/ high subsoil moisture levels.
Acknowledgements
I would like to thank Dr. Michelle Moyer at WSU Prosser for use of the vineyard and TJ Lange, Technology Manager, at Burrows Tractor for use of the Zasso electrical weeder. This project was supported the Washington State Grape and Wine Research program, as well as the Northwest Center for Small Fruits Research.
Disclaimer: No endorsement is intended for products mentioned, nor is lack of endorsement meant for products not mentioned. The author and Washington State University assume no liability resulting from the use of pesticide applications detailed in this report. Application of a pesticide to a crop or site that is not on the label is a violation of pesticide law and may subject the applicator to civil penalties up to $7,500. In addition, such an application may also result in illegal residues that could subject the crop to seizure or embargo action by WSDA and/or the U.S. FDA. It is your responsibility to check the label before using the product to ensure lawful use and obtain all necessary permits in advance.
Putting Sustainability in Action
Author: Melissa Hansen, Research Program Director, Washington State Wine Commission
Australian eco-vineyardist to keynote WAVE / Ravenholt seminar
The Sustainable WA vineyard certification program is about more than following vineyard management practices that are good for the environment and work force. It’s also about keeping wine grape growers economically viable, which in today’s uncertain wine market, is paramount. Sustainability in Action, the theme of the 2025 WAVE / Ravenholt seminar, includes topics to help wineries and growers reduce input costs. The seminar will be held on April 23, 2025 from 8:00 a.m. to 5:00 p.m. at Washington State University’s Tri-Cities campus in Richland.
Two events are combined this year—WAVE (Washington Advancements in Viticulture and Enology), which is the Washington wine industry’s signature research event and co-sponsored by the Washington State Wine Commission and Washington State University, and the WSU Ravenholt Lecture series. The lecture series is supported by an endowment from Albert Ravenholt, a pioneer of the Washington wine industry and founder of Sagemoor Vineyards. The WAVE / WSU Ravenholt seminar is a day for education, celebration and connection.
Keynote speaker: Mary Retallack
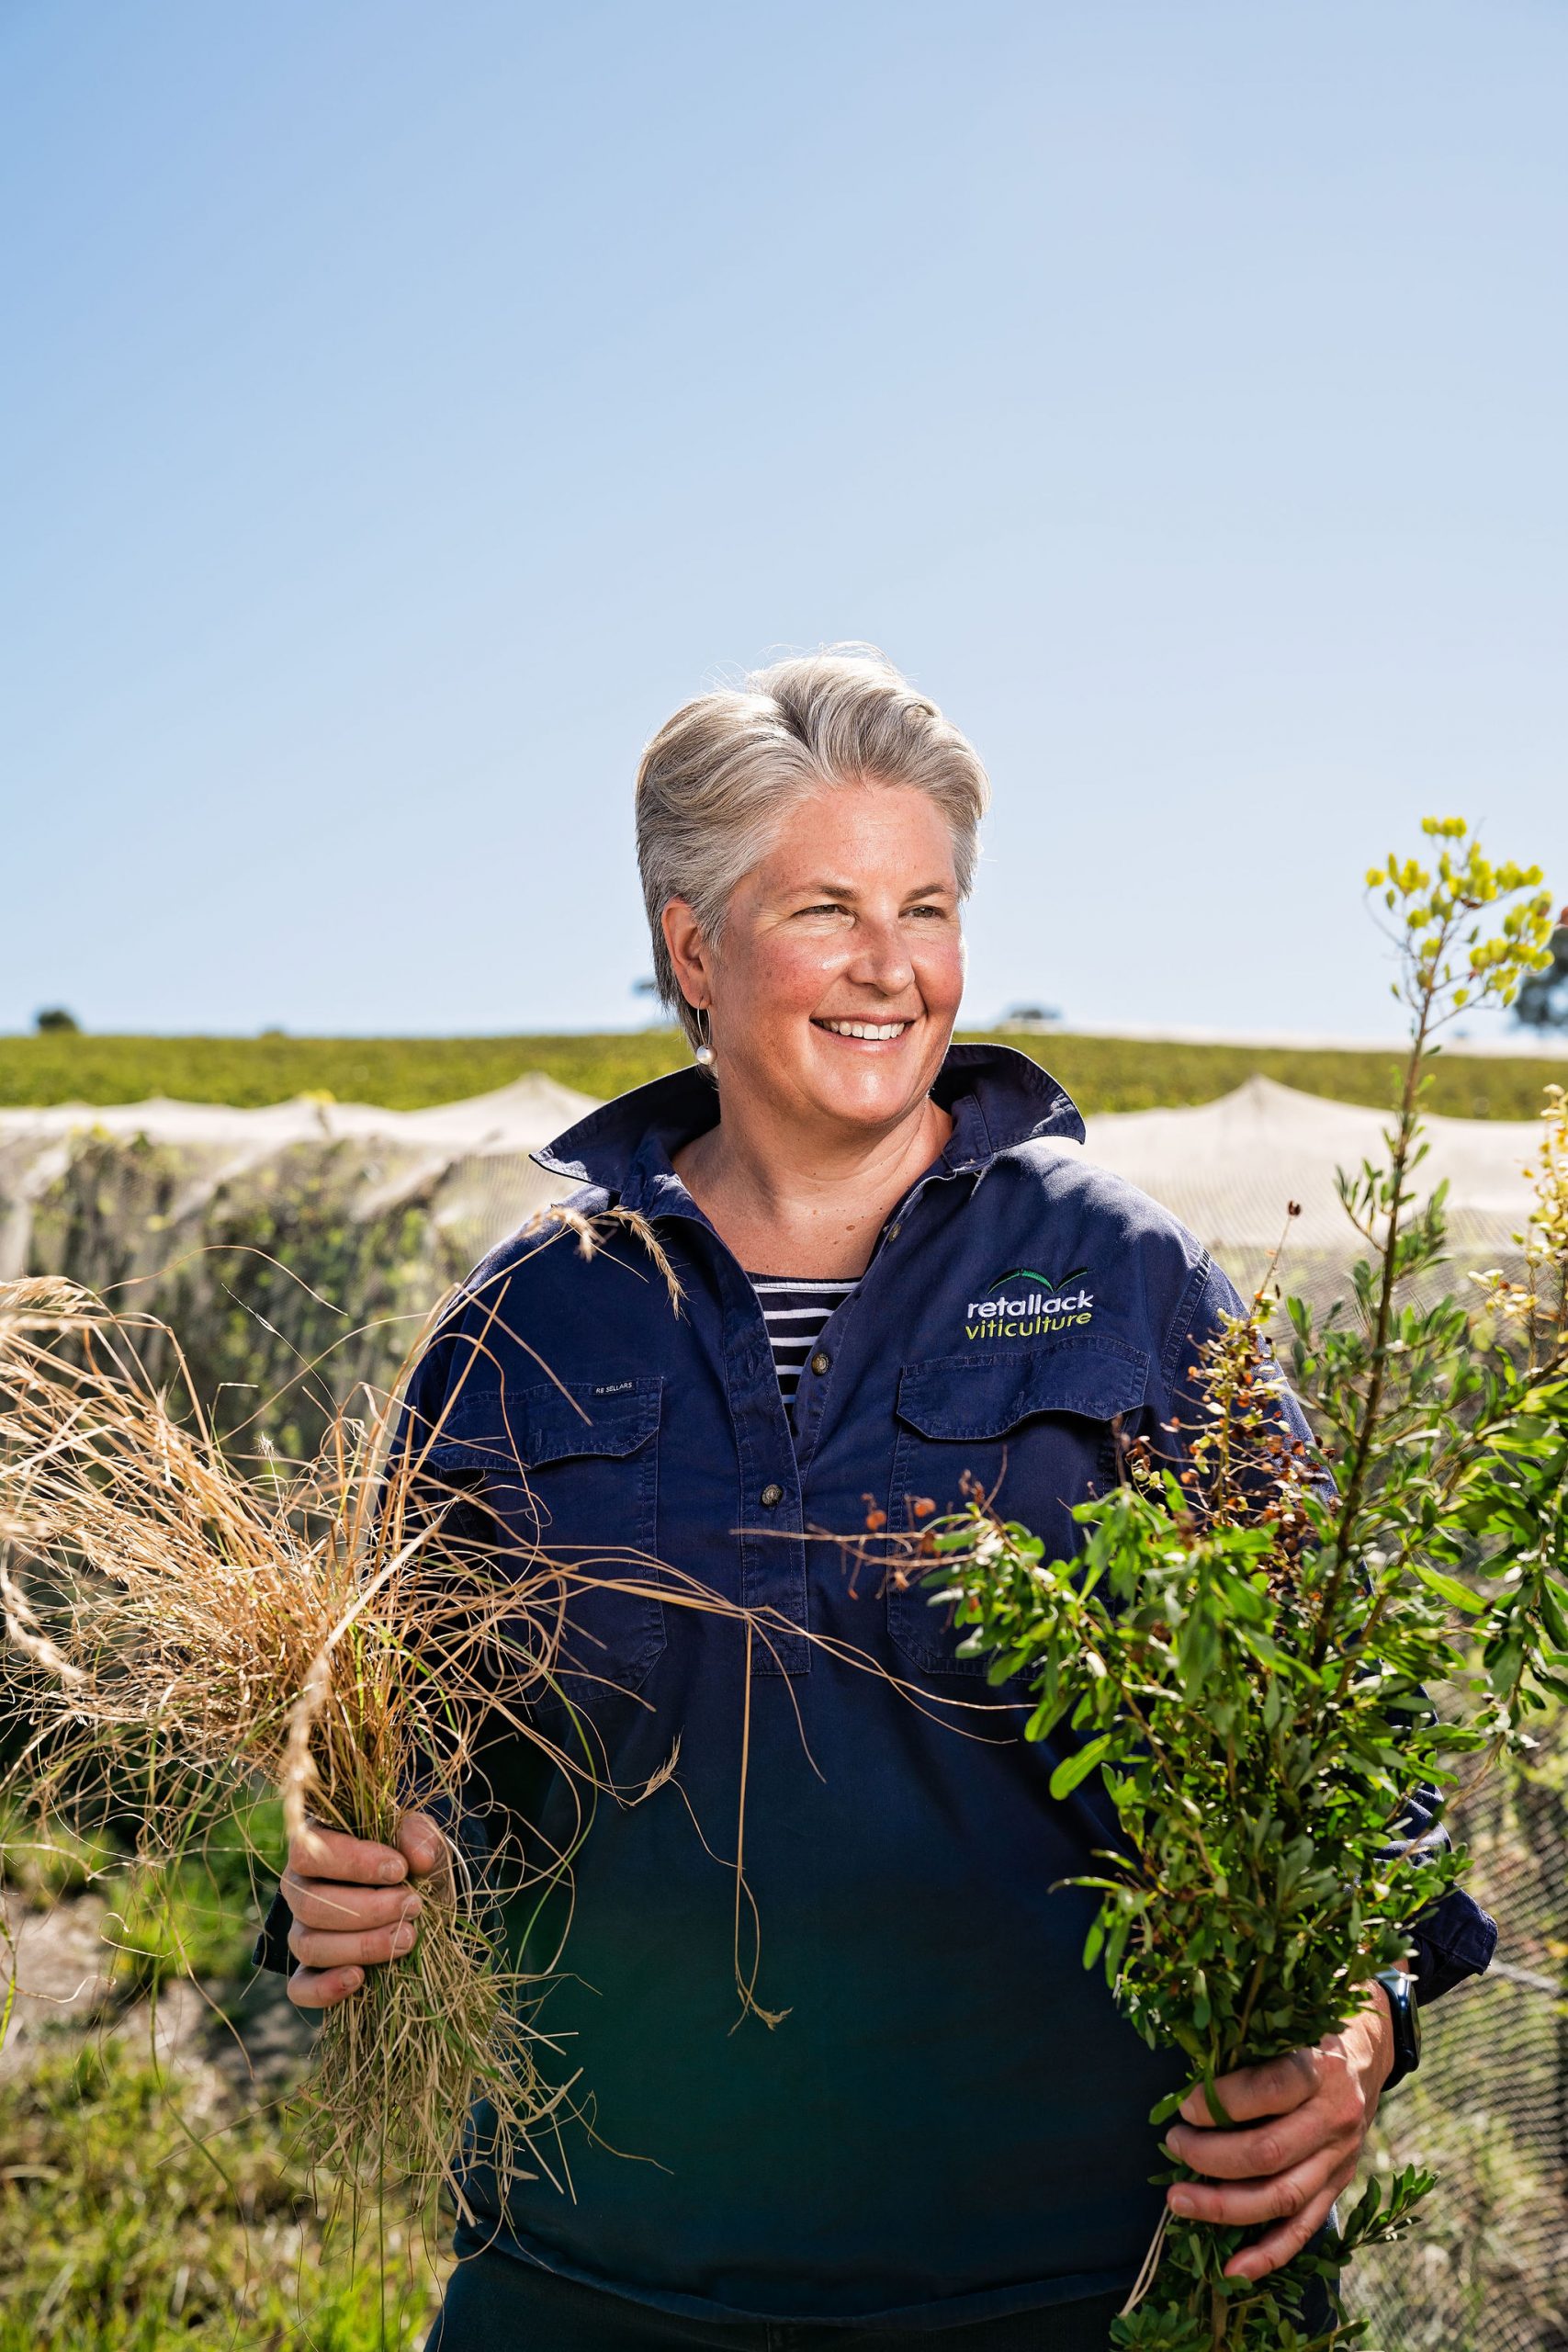
Third generation viticulturist, internationally renowned scientist and agro-ecologist Mary Retallack will give the WSU Ravenholt Lecture keynote address. Retallack owns a viticulture consulting company that provides services within Australia and globally. She co-founded and manages the National Ecovineyards Program, a three-year, $2.2M regionally based initiative funded by Wine Australia.
The program encourages growers to plant cover crops, enhance soil health and improve vineyard biodiversity, working across nine growing regions with more than 75 demonstration sites. Growers have access to region-specific resources, regional coordinators and extensive online resources. The vineyard demonstrations incorporate planting native species of plants to provide beneficial insect and pollinator habitat, which benefits the vineyard ecosystem as well as vineyard aesthetics and the distinct look that is unique to Australia.
Australian vineyardists are leaders when it comes to functional biodiversity. Management of more than 370,000 acres of wine grapes in Australia are influenced by the Ecovineyards Program, according to Retallack. Her participation as the Ravenholt Lecturer speaks volumes about the Washington wine industry’s commitment to wine quality and sustainability.
During Retallack’s stay in Washington state, she will speak to students and researchers, visit eastern Washington vineyards and wineries, and explore collaboration with the Washington wine industry.
Other WAVE topics
Vineyard topics at the seminar include sustainable approaches to managing diseases; integrating lasers, robotics and more into weed control; and using mating disruption to control mealybug. Winery topics will cover managing alternatives to oak barrels to save costs; sustainable approaches to winery sanitation that saves water and energy costs, and discussion of wine eco-label trends. Research posters will be on display throughout the day.
Also, the promotion and marketing campaign for Sustainable WA will be unveiled by GreenRubino, a Seattle marketing firm. The campaign is funded through a Specialty Crop Block Grant awarded to the Washington State Wine Commission from the Washington State Department of Agriculture. The seminar concludes with a celebration of Sustainable WA members during a wine social hour.
Sustainable WA, developed by and for the Washington wine industry, was launched in 2022. About one-third of the state’s wine grape acreage has been certified and wines with the program logo are now available in the market.
Seats are limited and pre-registration is required. For agenda details and registration ($40) information, visit: https://cvent.me/OxwomR.
We’ve made it as easy as possible to stay informed with the latest innovations. If you aren’t receiving research news, what are you waiting for? You could be missing valuable information! Send an email to:
mhansen@washingtonwine.org to get on the research email list.
WSDA Pesticide Licenses – New Requirements for License Holders
Author: Michelle Moyer, WSU Prosser IAREC
Beginning on 1 January 2026, all individuals who are renewing their WSDA Pesticide Applicator’s License will have to take one or more Certification and Training (C&T) course or quiz, in addition to having required educational credits, to keep their license active.
Most commercial and private applicators will only need to take the Certification and Training course or quiz to complete satisfy the new requirement. Other license types or special endorsements, including those using drones, or a sulfur dioxide fumigate endorsement, will have additional coursework and exams to renew their license.
When do you need to complete this new training requirement? Before the end of your certification cycle.
For more detailed information on these new requirements, visit the WSDA “Certification and Training Rule Changes” page.
WSU Extension programs and employment are available to all without discrimination. Evidence of noncompliance may be reported through your local WSU Extension office.
![]()