VEEN is curated by WSU Viticulture Extension. For questions on articles, or to request to submit an article in future issues, reach out to Michelle Moyer.
This issue of VEEN was originally published as a .PDF in September 2021, and posted online. Some content here will differ from that original issue. The issue is archived, but accessible on the VEEN Archive webpage.
A Note from the Editor
The 2021 vintage is another one for the record books. Here at WSU Prosser, we went from a nighttime low recorded temperature of 42°F on June 6, to a daytime high temperature recorded temperature of 113°F. In the months of May, June, and July, we had 17 nights below 45°F (including a 34°F night on May 8), and 28 days above 95°F. Needless to say, it was a year punctuated with little to no powdery mildew disease pressure, poor fruit set and otherwise lower yields, high water demand, timing, heat stress, and sunburn.
Lower-than-expected yields? Most likely due to some later-spring frosts that slipped under the radar (in Prosser, there were 2 nights in April with temperatures under 28°F, and 15 nights between March and April with temperatures below 30°F), and less-than-optimal weather conditions such as extreme high temperatures during and immediately after bloom. Later summer cluster rots, like Rhizopus, which are typically only seen in humid, warm climates? Likely due to sunburn damage to fruit and the rapid return of dewpoints creating the perfect conditions of available food source and optimal environment. Merlot harvested before Chardonnay? Variety ripening patterns go out the window when there is extreme shifts in weather patterns.
But there is also some excellent-looking fruit out there, highlighting the quick-thinking and skills of Washington growers — folks who adjusted their watering patterns to account for extreme heat generally made it through our “heat dome” with minimal damage. Those adopting early shoot thinning and leaf removal over traditionally later timing had less sunburn, along with those who chose to go more sprawl this year rather than emphasizing a manicured look. Let’s take those wins when we can get them!
Michelle M. Moyer
Viticulture Extension Specialist
Professor of Viticulture
WSU Prosser IAREC
Table of Contents
Connect With Us
V&E Certificate Program
Japanese Beetle Update
By Washington State Department of Agriculture
After catching just three Japanese beetles during last summer’s trapping program, WSDA is now catching thousands of the beetles in the Grandview area – over 20,000 and counting. While the highest number of catches are in the residential area of the town, there have been numerous smaller catches in the rural outskirts of town, including a few in Sunnyside.Japanese beetles are a highly invasive pest that consumes the leaves, buds, and flowers of over 300 different plants in the adult stage and feeds on roots in their larval overwintering stage. Crops that include some of their preferred snacks include roses, grapes, hops, cherries, sweet corn, turf grass and many other crops grown in the Yakima Valley. It is also a nationally quarantined pest.
WSDA Quarantine
WSDA has an existing Japanese beetle quarantine for plants delivered from other states, but the agency recently began the process of establishing an internal quarantine to prevent the human spread of Japanese beetles while the department attempts to eradicate the pest. Both the boundaries and the commodities to be quarantined have yet to be determined, but WSDA is working quickly with experts on the various commodities grown in the area while learning from the Oregon Japanese beetle quarantine. What will be quarantined depends largely on when harvest occurs and whether the plant material or soil to be moved is likely to move any life stage of Japanese beetles. Crops that are harvested after adult flight ends (usually in September) and which do not move soil are unlikely to be impacted.
Once draft quarantine specifics are available, a small business economic impact study will be completed and before the quarantine is finalized, there will be many discussions with industry representatives as well as public comment opportunities. WSDA anticipates finalizing the quarantine language and having the quarantine in effect by early 2022.
Eradication Efforts
Also anticipated for the spring of 2022 is an eradication effort. Given the large population that has been found, WSDA expects this to be a multi-year effort. Estimates are that it could take as many as 5-10 years if the population can be eradicated.
There are many ways to stay informed about WSDA’s Japanese beetle trapping, quarantine, and eradication efforts:
- Visit WSDA’s Japanese beetle webpage.
- Sign up for WSDA’s Pest Program email listserv (make sure the Japanese beetle box is checked)
- Join WSDA’s Japanese Beetle Watch Facebook group
- •Find updates about Japanese Beetle Quarantine rulemaking
In addition, there are steps you can take to help in the state’s efforts to detect and eradicate Japanese beetle from Washington.
- If Japanese beetles have been found on your property this year,consider treating your property.Business can consult their pest management professionals. Homeowners can follow WSU Extension’s recommendations. Please note that not all products labeled for Japanese beetles are effective for them, so be sure to follow WSU’s or your pest management professionals’ recommendations.
- If you have been trapping for Japanese beetles and have caught any, please report your catches and the location. There are two ways to submit yourt rapping results:
- Count the beetles and submit a photo and the number trapped using the Japanese beetle reporting form.
- Write your address or cross street on the trap and leave the trap in the cooler at the entrance to Bleyhl’s in Grandview.
- Learn about Japanese beetles and the damage they cause.Help spread the word to neighbors so they understand the importance of reporting and eradicating this pest.
No doubt with the number of Japanese beetles that WSDA is catching, the Pest Program has a monumental task ahead to try to eradicate this pest. But the support received so far from the agricultural industry, the local community, and even individual property owners is encouraging. By working together, we stand a chance at eradicating this highly invasive pest.
AgWeatherNet Updates
By Lav Khot, WSU AgWeatherNet
MOBILE FRIENDLY AWN WEB PORTAL
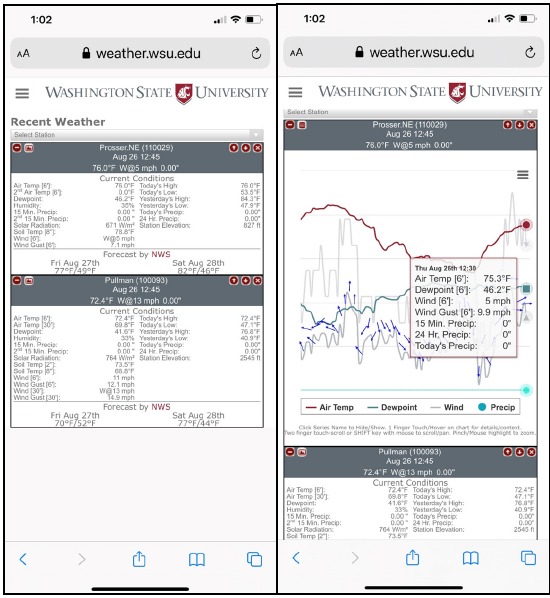
WSU AgWeatherNet (AWN) has developed lite version (beta) of our web portal for users to access weather data from specific station(s) on their smartphones/tablets. The lite version is aimed at improving access to the data when user is in the field or otherwise prefers to use handheld smart devices. Registered users can access the web portal.
This lite version is intended to provide quick snapshot of current weather at AgWeatherNet sites throughout Washington, including air temperature, dew point, wind, precipitation, solar radiation, soil temperature and moisture. The data display also includes forecast temperature highs and lows from the National Weather Service for the next 48 hours. Users can switch to desktop version by clicking on ‘AWN Desktop’ link that is available on dropdown menu on left-top of the screen.
For a selected station, user can switch between table view (Fig. 1, left) and interactive weather chart (Fig. 1, right). Chart displays selective parameters data for past 24 hours. Touch scrolling on chart displays all the data at selected time stamp. Charts can also be zoomed in/out and are downloadable for sharing with others. Sean Hill, AWN Systems Analyst and Developer received inputs from AWN team as he developed this beta version. He will continue to improve upon this version to add more generalized capabilities. Users are encouraged to submit suggestions or feedback via e-mail.
NETWORK IMPROVEMENT
At present, we have 399 stations data flowing through our portal. We have 199 AWN installed and maintained weather stations as well as 114 privately installed/maintained stations. If you are interested in adding a private weather station, visit our website for additional details. Independently, AWN continues to rebuild our weather network with upgrade, replacement of our legacy stations as well as addition of new stations. Thus far, we have added 14 tier-1 30-ft towers spread across the state to collect data at professional+ quality per the National Mesonet Program standards. We are also transitioning some of the old the legacy hardware with rugged, easy to maintain all-in-one weather stations. If you are interested to know more about our network rebuilt or station addition/upgrades, do reach out to us via weather@wsu.edu or to AWN field meteorologists in your region; Jonathan Contezac at WSU Mount Vernon; Kai Carter at WSU Wenatchee; or Mark Ingalls at WSU Prosser.
HiRes Vineyard Nutrition
By Tom Groenveld, Project Manager, WSU Prosser
How should we fertilize different grapevine varieties, when they are grown in varied environments for different production goals? A national research and extension project led by WSU aims to answer this question. High Resolution (HiRes) Vineyard Nutrient Management is a four-year USDA-NIFA-SCRI sponsored project that started in the fall of 2020. Additional funding is provided by Washington’s wine and juice grape industries.
The over arching goal of the project is to enable grape growers to make data-driven nutrient-management decisions for spatially heterogeneous vineyards and diverse production markets. Anticipated project deliverables include:
- Non-destructive sensing tools to measure vine nutrient status;
- More precise, region-specific plant tissue sampling procedures and guidelines for more precise nutrient management;
- Decision-support tools for vineyard nutrient status mapping to aid variable-rate nutrient application and evaluate economic performance; and
- Website and durable extension publications outlining best nutrient management practices and economic impact of improved nutrient management and sustainability.
Because effective nutrient management is multi-faceted and requires effective long-term solutions, our approach integrates collaborative research and extension by investigators from multiple disciplines and institutions. The project team is composed of four focus groups with distinct specializations, some of the work they are engaged in and where we hope to go from here is summarized below.
SENSORS / ENGINEERING
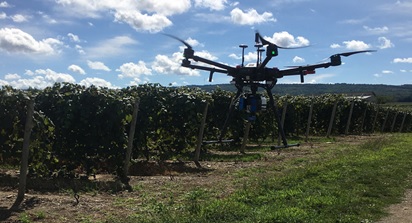
The goal of this group is to create nutrient status maps for entire vineyards. In California (UC-Davis) and New York (Rochester Institute of Technology), multispectral and hyperspectral sensors hooked onto unmanned aerial system (UAS) platforms were used in 2020 and 2021 to collect spectral imagery data from commercial vineyards that had induced nutrient deficiencies (Figure 1). The timing of the images coincided with tissue sample collection for ground truthing, and the images were used to create different nutrient prediction models using subsets of optimized wavelengths.
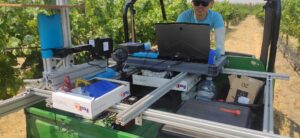
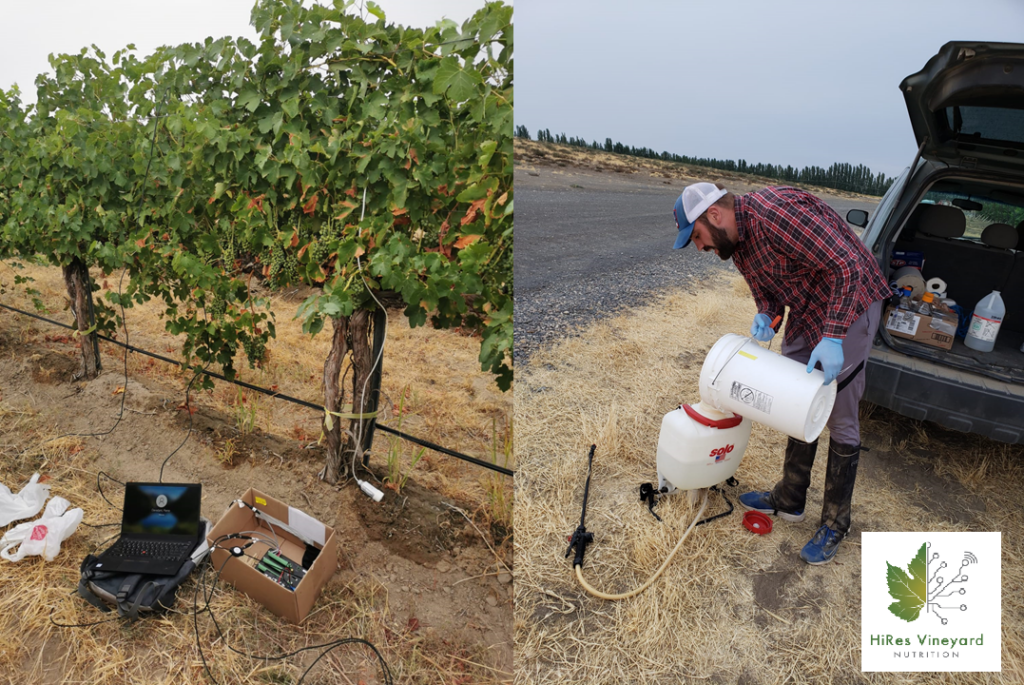
Due to the vertical trellising of many vineyards, the canopy may be more visible from the ground than from above. This is being tested in Washington (Washington State University) where hyperspectral and other sensors were hooked onto a utility vehicle to get a side-view of the canopy, again with the timing synchronized to tissue sampling (Figure 2).
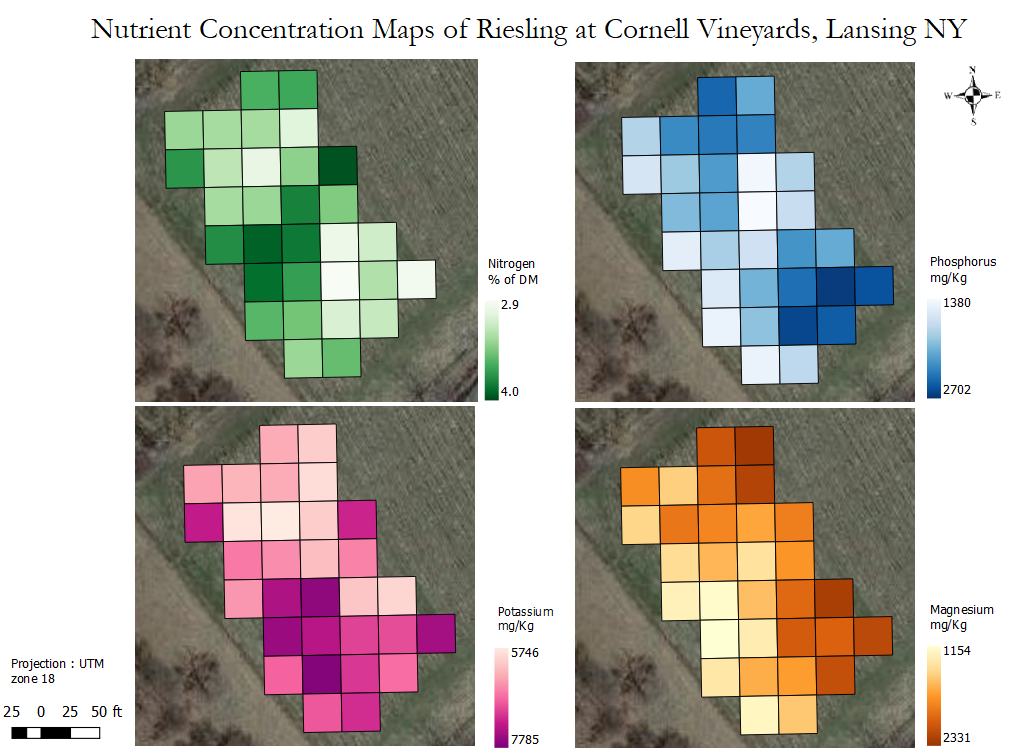
PRECISION AGRICULTURE
The main goal of this focus group (Cornell, UC-Davis, Virginia Tech) is to translate spatial nutrient sensor data into actionable variable-rate vineyard nutrient management for commercial producers (Figure 3). Several processing steps are required to convert raw sensor data into usable viticulture information for more informed management decisions, and growers need research-based knowledge and access to affordable spatial-data processing tools for successful precision viticulture implementation. MyEfficientVineyard (MyEV), a free web-based spatial-data analytics software platform that was previously developed by some of the team-members at Cornell will be used to process and visualize sensor data for vineyard maps.
PLANT NUTRITION
Field trials were established in California, Washington, Oregon, New York, and Virginia to serve as test beds for sensor development, ground-truthing, and validation (Virginia Tech, Cornell, USDA-ARS, UC-Davis, WSU). Another objective of the tissue sampling carried out at these sites is to modernize the sampling protocols for more accurate and timely nutrient assessment in vineyards. The trials are also used to quantify the yield and fruit and product quality response to different amounts and methods of fertilizer application (Figure 4).
SOCIAL SCIENCE / EXTENSION
To get key information on how growers are currently sampling their vineyards and making nutrient management decisions the economics and extension team (Oregon State University, WSU, UC-Davis) carried out an industry survey which was completed by 322 individuals representing approximately 10% of the US vineyard acreage. While respondents indicated that vineyard nutrient management accounts for only ~10% of their annual production budget, 65% rated nutrient management as being very important to extremely important to quantity or quality of grapes produced. Existing datasets from 22 farms in Oregon have been used in a meta-analysis to explore the factors that affect yield and fruit composition, this will form the basis for an econometric model that incorporates yield and nutrient data.
Moving forward the main objectives remain to develop non-destructive sensing tools to measure vine nutrient status, region-specific plant tissue sampling guidelines, and decision-support tools for vineyard nutrient status mapping to aid variable-rate nutrient application. These tools will help optimize inputs and business profitability via improved vineyard productivity and fruit and product quality, while minimizing adverse impacts on the environment that result from over-application of fertilizers. Stay posted these developments at our HiRes Website or on Twitter, Instagram, and LinkedIn.
Intelligent Sprayer Retrofit for Airblast Sprayers
By Anura Rathnayake U. of Arkansas; Lav Khot and Gwen Hoheisel, WSU; and Heping Zhu, USDA-ARS
THE RETROFIT SYSTEM
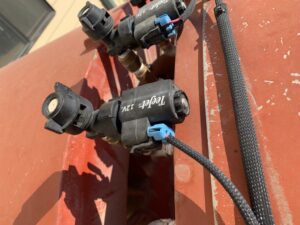
The agricultural technology landscape is changing rapidly, and several options exist to convert your conventional axial-fan or tower type airblast sprayer to an intelligent or precision sprayer. This article discusses one such retrofit. An intelligent spray system was originally developed by the USDA-ARS in 2014 and is now being commercialized by Smart Guided Systems (Intelligent Spray Control System™). The typical retrofit mounted on a Rears Powerblast sprayer is shown in Figure 1. The retrofit hardware includes a sensing unit, control unit and pulse width modulation-type (PMW) solenoid values with attached nozzle bodies (Figure 2) to achieve variable rate spraying.
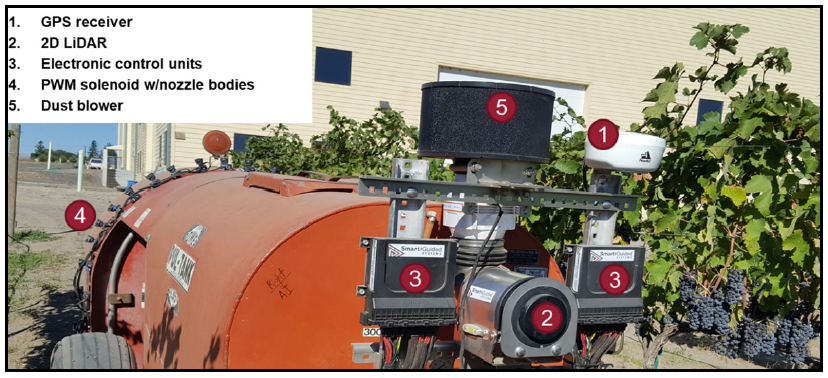
A 2D light detection and ranging sensor (LiDAR; model SICK LMS) and a GPS receiver unit (NOVATEL Ag-Star) are core to the retrofit system sensing unit. Essentially the LiDAR and GPS unit work together to create a 3D ‘image’ of the canopy. The LiDAR mounted in front of the sprayer collects dense point cloud data at a fast rate (50 scans per sec). Think of the point cloud data like pixels in an image and the more pixels (or data) that is available, the clearer the image. Through this process, canopy height, volume, and density factor can be calculated in real-time. A GPS receiver provides the geo-referencing and forward travel speed of the sprayer. Lastly, as dust on LiDAR scanning lens can be a problem, the unit has an air blower that runs at all the times to keep the lens surface clean.
The control unit uses a tablet (Samsung Galaxy Tab Active Pro) and two Electronic Control Units (ECU). Each ECU can control up to 12 PMW solenoid valves (TeeJet 12V e-ChemSaver 115880-1-12). Each solenoid value is normally closed and needs 12V DC power to pulse at high rate (10 Hz) to keep the nozzle ON or to change the pulse width (duty cycle) for variable spray output. For example, 100% duty cycle will fully open the solenoid whereas 25% will open it for only 25% of the time. The solenoid valves are designed to operate with different types of nozzle bodies and perform best for up to 100 psi. The tablet has a pre-installed app ‘Intelligent Spray’ that allows customization for:
- Manual or automated mode of sprayer operation;
- Number of nozzles (ON / OFF)on each sprayer side; and
- The base spray rate to match to the canopy growth stage.
CONFIGURATION AND USAGE
The retrofit system often is powered by the 12V DC supply from the tractor battery. While the sprayer does have automation capabilities, it is critical for the operator to ensure that all electrical and spray components are working properly before an application.
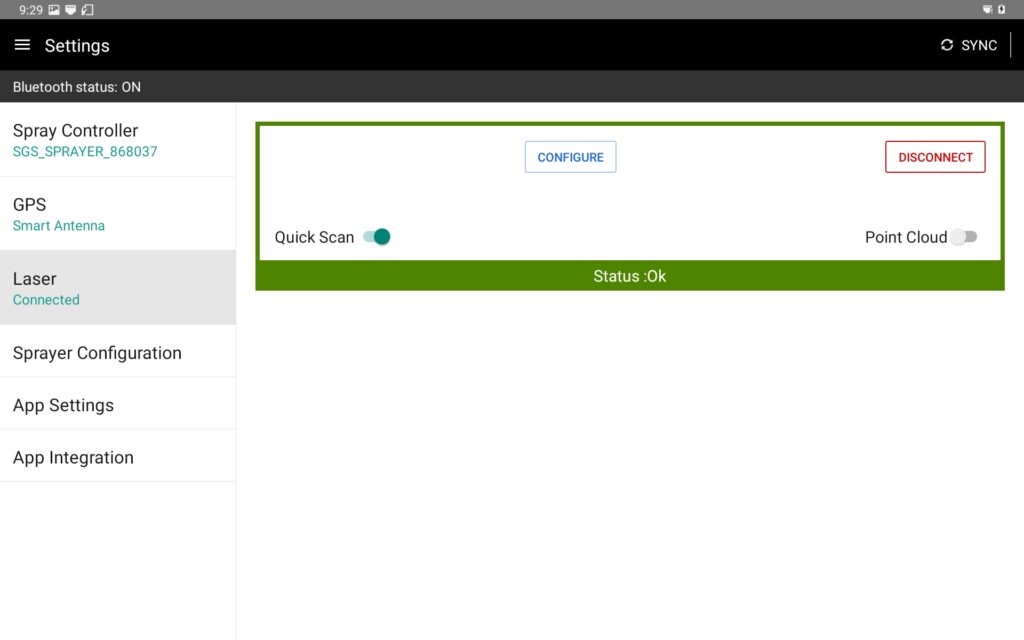
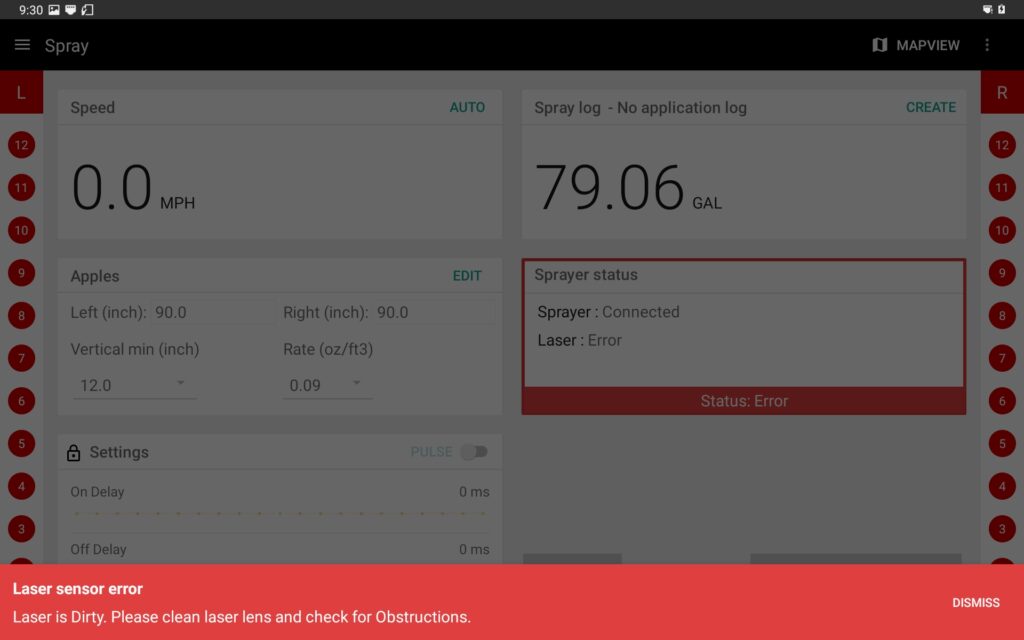
The first step after the system is powered ‘on’ is to check the ‘Settings’ window of the ‘Intelligent Spray’ app on tablet to ensure connectivity (Figure 3) between the tablet, LiDAR, GPS receiver, ECUs, and solenoid valves. If they are connected properly, the status “OK” will be displayed in a green box. In some situations, the connectivity to the LiDAR sensor can be displayed as “not connected” and Laser “error” (Figure 4) indicating dust deposition on the scanning lens surface.
While it is recommended to keep the blower running at all times, the laser surface should be cleaned occasionally with a microfiber cloth or lens wipes. As the LiDAR sensor is connected to the tablet via a USB-ethernet connector, precautions should be taken to prevent damaging, loosening, and contaminating those connections.
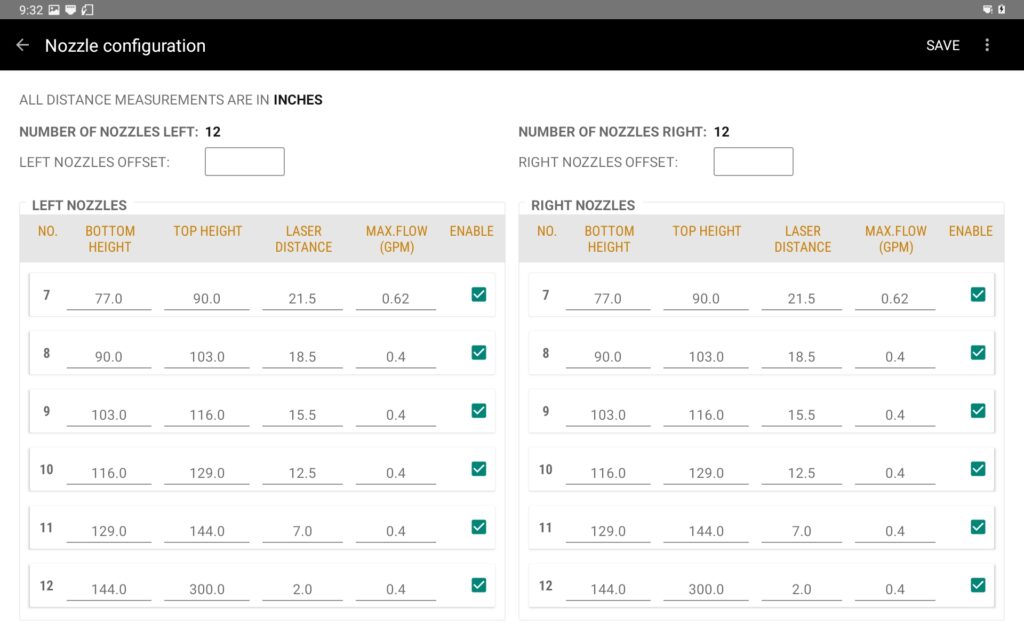
The next step is to calibrate and optimize the sprayer to ensure correct nozzle use and nozzle flow rate. See Six Steps to Calibrate and Optimize Airblast Sprayers for Orchards and Vineyards. Once the operator determines the number of nozzles to be used, the section of the height sprayed by each nozzle can be set in the ‘Intelligent Spray’ app (Figure 5).
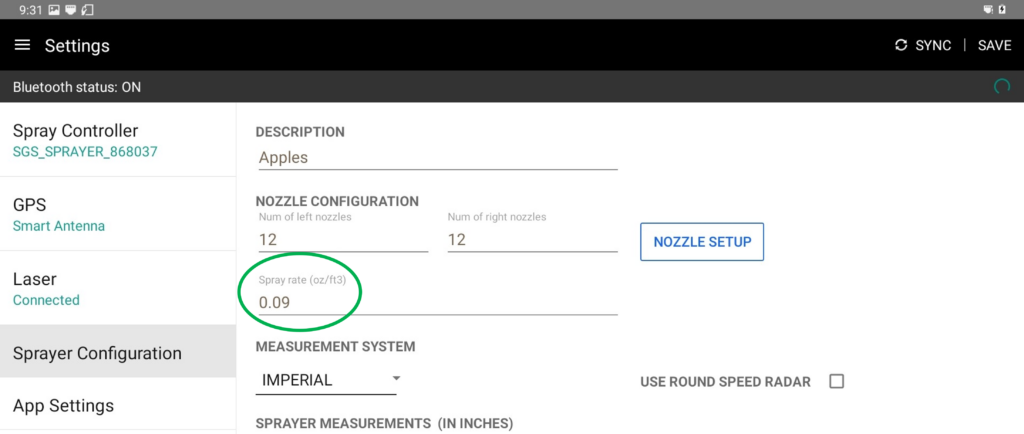
Then, the most critical parameter is the setting of base spray rate (Figure 6). Simply, spray rate is amount of liquid that will be sprayed per cubic ft of the canopy. Manufacturer recommends starting with lower spray rates (typically 0.06 oz per cubic ft) and assess the coverage with water sensitive paper (WSP). Increase the spray rate, and repeat the coverage assessment process, until you find a rate that results in acceptable coverage with WSP.
THE NEXT STEPS
The above process to decide the base spray rate is tedious and subjective. Therefore, WSU Precision-Ag research team is working on developing a simplified method to determine the input spray rates for different canopy shapes. Specifically, we are evaluating suitability of using tree-row-volume and unit-canopy-row to estimate the spray rate that must be entered (Figure 6) as opposed to trial-and-error with water sensitive paper. This work and analysis are currently underway, and more results will be shared later when fully analyzed.
The tree-row-volume method [1] assumes that each tree or vine row is a wall of foliage and the spray rate required to treat that wall is related to the volume of foliage within that wall. Spray rate adjustments are primarily based on the canopy size, density, and pruning level. Based on the several years of spray trials conducted in North Carolina [2], the Midwest Tree Fruit Spray Guide provides density estimates and corresponding spray rates in the range of 0.08 to 0.12 oz per cubic ft for tree fruits. They offer similar rates for grapevines, with the lower rate for open canopies, and the higher rates for dense canopies.
The unit-canopy-row method provides the amount of spray liquid required for treating 328 ft (100 m) of tree or vine row length of unit canopy (3,531 cubic ft / 100 cubic meter of canopy foliage) and adjusts the application rate on the basis of crop row length rather than the ground area [3]. Previous studies have suggested the effective rate for spraying pome and stone fruits ranges from 0.07 to 0.11 oz per cubic ft (23 to per 36 oz per unit canopy row) [4], and they recommend 0.3 oz per cubic ft (75 oz per unit canopy row) for grapevines.
SUMMARY
Prior research data suggests that the intelligent sprayers can save up to 70% of chemicals depending on the crop, canopy architecture, and growth stage [5,6] . Our recent studies have also found that the intelligent sprayer provides similar or better spray deposition and coverage than a conventional sprayer when used in tall spindle apple canopies. Importantly, crop and canopy specific spray rate optimization would be critical for precision application of this or a similar retrofit system. Our team plans to perform research on suitability of tree-row-volume and unit-canopy-row based spray rate optimization and pertinent sprayer performance evaluations in modern VSP trained grapevines.
References
- Byers, Hickey, Hill. 1971. Virginia Fruit 60: 19–23.
- Sutton & Unrath. 1988. Plant Dis. 72: 629–632.
- Deveau. 2009. Six elements of effective spraying in orchards and vineyards. Ontario, Ministry of Ag.
- Furness, et al. 1998. Crop Prot., 17(8): 639–644.
- Chen, et al. 2012. Trans. ASABE, 55(3): 773–781.
- Khot, et. al. 2012. Biosystems Eng 113: 76–85.
Washington Wine Research 101
By Melissa Hansen, Research Program Director, Washington State Wine Commission
FOUR THINGS TO KNOW ABOUT VITICULTURE AND ENOLOGY RESEARCH IN WASHINGTON STATE
Washington’s wine research program is unique. It’s one of a few in the nation funded by all Washington wine grape growers and wineries, guided and driven by industry, and with results accessible to all Washington vintners and wine grape growers, regardless of size.
We’re thankful for the state’s wine industry pioneers and early Washington State University scientists that laid the foundation for today’s viticulture and enology research program. But it’s the Washington wine industry’s research commitment in the last decade to develop strategic research plan to ramp up the program and robust, stable and sustainable funding.
What follows are four key things to know about viticulture and enology research in Washington State to better understand how it’s funded and how it works.
RESEARCH BEGINNINGS: HOW WAS IT STARTED?
In 1937, Dr. Walter Clore joined WSU’s Prosser research station as a fruit scientist. Clore, later named “The Father of Washington Wine,” saw potential for Washington to be a premium wine region and began trials of wine grape varieties in Eastern Washington to determine what would grow where and under what conditions. He was encouraged by the success of vineyards planted by W.B. Bridgman, a businessman in Sunnyside who helped bring irrigation to Yakima Valley. Bridgman planted his first wine grape vineyard in 1914. Dr. Chas Nagel, WSU food scientist in Pullman, produced wine from Clore’s trials.
This early relationship between WSU and the wine industry laid the foundation for today’s strong research partnership between the Washington wine industry and WSU and the industry’s commitment to research.
RESEARCH FUNDING: HOW IS RESEARCH FUNDED?
In the 1960s, industry pioneers secured Department of Commerce grants to help support V & E research at WSU. When the grants dried up, a group of Yakima Valley growers and wineries lobbied for a more permanent way to support research. State Senator Max Benitz of Prosser authored the Wine Tax, enacted in 1981, which designated that part of the state taxes collected on all wine sold would be appropriated to WSU for viticulture and enology research. This funding created the Washington State Grape and Wine Research Program, a competitive grant program for WSU researchers.
Since 2000, a blend of public, private and industry funds have contributed to the statewide research program from WSU, the Washington State Wine Commission and the Auction of Washington Wines. The Washington Wine Commission created two complementary grant programs in 2019 to support research beyond WSU. The first grant program encourages student interest in research by funding short-term demonstration projects at Washington community colleges. The second grant program fosters collaboration by supporting research conducted at other wine regions and universities.
INDUSTRY-DRIVEN RESEARCH: HOW DOES IT WORK?
The Wine Tax legislation that created continuous research funding also required that the Washington wine industry guide the research conducted at WSU. Initially, an ad hoc volunteer group of winemakers and wine grape growers on what was called the Wine Advisory Committee (now called the Wine Research Advisory Committee) and provided research funding recommendations to WSU. In 1998, the Washington State Wine Commission board of directors formalized the volunteer group to make it a subcommittee of the Washington Wine Commission, with members appointed by the Board. WRAC reviews research proposals during the annual Research Review, which is hosted by the Washington Wine Commission. Industry members have several ways to weigh in and guide the research program. Industry input on research priorities is collected each year through the Research Survey conducted by the Washington Wine Commission. Research priorities are reviewed annually by WRAC and revised based on feedback from the survey. These priorities drive the research program and keep research relevant to industry needs. Additionally, industry is asked to provide input to WRAC on specific research proposals during the Research Review.
WRAC serves as the wine industry’s research review arm and makes research funding recommendations to the Washington Wine Commission Board for approval.
RESEARCH CULTURE: HOW TO APPLY RESEARCH
Numerous avenues have been created to help growers and winemakers access research results and engage in their research program:
- Washington Advancements in Viticulture and Enology (WAVE) research seminars and WAVEx (condensed format) webinars, co-sponsored by WSU and the Washington Wine Commission, have become Washington wine industry’s signature research event. Nearly 1,700 have attended WAVE and WAVEx events since the inaugural WAVE in 2016, including 300 in 2021.
- WAVE Report, a bi-monthly newsletter, helps keep the industry abreast of research-related events, research in the news, key findings of current research and profiles of scientists.
- Research articles and stories, published in trade magazines like Good Fruit Grower and Wine Business Monthly, are written for easy digest of Washington wine industry-supported research and application.
- Research Review, held each February, is open to Washington wine industry members to hear progress reports of on-going research and weigh in on new proposals.
- WRAC Research Website has been updated and contains a wealth of research information, including the new Research Library that has archived more than 150 research reports, presentations, news stories and more.
- Become a member of WRAC. Learn about the WRAC organization structure, qualifications, and responsibilities. If you’re interested in becoming a future WRAC member, reach out to Melissa Hansen.

2021 Washington State Grape Society Annual Meeting
By Washington State Grape Society
The fall is almost here, which means Grape Society annual meeting time!
The Washington State Grape Society is currently planning for a 2021 in-person event, November 18th to the 19th in Grandview, WA. The organization will be monitoring state mandates closely, and will post annual conference updates to their website as they are available.
Visit the Washington Grape Society website for more event details and updates, or follow them on Facebook. Educational programing will include information on vineyard soil health, Japanese beetle updates, Phylloxera risk mapping updates, and more! There will also be a poster session featuring Washington-relevant grape research, as well as industry award and student scholarship announcements. Interested in having a booth or sponsoring? There are still a few exhibitor spaces and sponsorship opportunities. Fill out the Exhibitor and Sponsorship form to secure your spot!

WineVit 2022 – Mark Your Calendars!
Are you and your team ready to discover, connect, and engage?
WineVit™: Washington wine’s favorite event of the year is coming to Kennewick. Created BY industry FOR industry OF industry, WineVit™ is a milestone opportunity for YOU to discover innovative technology, connect with your peers, and engage with industry thought leaders.
Planning is full swing. Registration will open in Fall 2021. Keep up-to-date on Winegrowers social media pages (Facebook and Twitter) as well as checking back for new information on the WineVit website.
Remember, 2021 Winegrowers members receive significant discounts on their registration! Interested in becoming a member? Email us.
Are you a viticulture and enology student, educator, or researcher?
Consider participating in the Winegrowers Poster Session. This session provides unique and casual opportunity for the industry to come together to share and discuss new, relevant information and research. Poster categories include: undergraduate students, graduate students, and professionals. Additionally, this session provides an opportunity for graduate students to share their research during an oral presentation.
The call for posters will go out in September and submission deadline in mid-December 2021. As we get closer, more information and specific deadlines can be found at our WineVit poster webpage.