VEEN is curated by WSU Viticulture Extension. For questions on articles, or to request to submit an article in future issues, reach out to Michelle Moyer.
This issue of VEEN was originally published as a .PDF in September 2011, and posted online. Some content here will differ from that original issue. The issue is archived, but accessible on the VEEN Archive webpage.
A Note from the Editor
Summer has finally decided to show up, fashionably late. As the East Coast and Midwest recover from record high temperatures and an early harvest, we are still patiently waiting for full véraison. This truly is the calm before the storm….but lucky for us, that storm doesn’t equate to earthquakes, hurricanes or fall thunderstorms. Life is generally pretty good this side of the Rockies.
Speaking of the good life, the Viticulture and Enology program is proud to announce that the new Wine Science Center on the WSU-TriCities Campus is taking postive steps forward. The Richland City Council has approved the formation of a Public Development Authority, and the Washington Wine Commision has voted to provide close to $7.5 million for its construction. Other fundraising efforts continue with the Wine Campaign Committee led by Ted Baseler (CEO of Ste. Michelle Wine Estates), the Port of Benton, the City of Richland, and the WSU Foundation.
But back to the present: In this issue of VEEN, we have a wide breadth of topics. Updates on the vintage, pests, programs; discussions on high-Brix wine making, and updates on new TTB regulations, just to name a few. Hopefully you enjoy this issue as much as I did in organizing it: We have a very busy Viticulture and Enology program here at Washington State University!
Michelle M. Moyer
Viticulture Extension Specialist
Assistant Professor of Viticulture
WSU Prosser IAREC
Table of Contents
- 2011 Year in Review: Where was Summer?
- AgWeatherNet Update
- Research Update: Mealybugs in Washington Vineyards
- Update on the Brown Marmorated Stink Bug
- Virus Update: The Status of Washington Vineyards
- Brix and Alcohol: A Simple Measurement?
- Maceration Part 1: Focus on Phenolics
- Program Update: Wine Sensory
Connect With Us
V&E Certificate Program
2011 Year in Review: Where was Summer?
By Michelle Moyer WSU Prosser
If grape production was easy, we wouldn’t define wine by the vintage. This year presented WA viticulturists with a series of challenges, challenges which are often only dealt with on a decade scale. But challenges, regardless of irritation or frustration, provide an opportunity to learn. In 2011, we cannot deny the ample supply of teachable moments.
Growing Degree Days: What does it mean?
Using growing degree days (GDDs) to assess a growing season can be a helpful (see related AgWeatherNet article). However, there is often a misunderstanding between the quantity, and quality, of those accumuated units. A “hot” year (higher GDDs) does not necessarily mean favorable conditions for plant development. Grapes begin to shut down at temperatures above 95°F, so while these temperatures result in higher GDD accumulation, they are not necessarily what is best for the plant. When nighttime temperatures routinely fall below 50°F, a similar situation occurs. Ideally, lows in the 60s and highs in the upper 80s to low 90s result in the highest “quality” of GDD accumulation.
How does this play into the big vintage picture? When we compare how vintages relate based on GDDs, we have to consider the extremes. While 2011 appears to be three weeks behind average based on GDDs, in terms of plant development, it looks to be closer to 5-7 days behind. The take home: While GDDs are a great way to get a snapshot of how the season is progressing, it is not a complete descriptor of the current vintage’s growing (and quality) capacity.
Freeze and Frost Damage
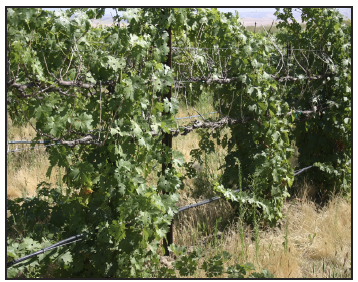
Winter freeze damage from November 2010 and February 2011 were painfully visible in some parts of WA this spring (Fig. 1). Economic questions regarding the tipping point between individual vine and entire vineyard retraining were raised, and rightly so. Complete replanting was also considered, but sourcing stock is a challenge in years like this one. Unfortunately, there are no real right and wrong answers to the plethora of situations that were presented. Some people spot-retrained, others broke out the bulldozers. However, we do know that variability increases the costs of farming. As a general rule of thumb, if variability within a managed unit starts to go beyond 30%, then starting over to regain uniformity may be the best choice.
A challenge that is often coupled to a retraining situation is managing subsequent vine vigor. Vine age needs to be considered when determining the number of suckers to be retained. In young plants, a limited root system reduces the available nutrient reserves from which the vine can draw to support new shoot development. A similar scenario is seen in older plants which might be contending with years of accumulated stress and damage.
With vines that are about 5-15 years old, the established root system often provides more than enough nutrient reserves, resulting in excessive shoot growth. This is especially true if insufficient suckers are left to redistribute this energy.
On a related note, while the cool, wet spring temperatures were viewed unfavorably in terms of initial vine development, they were likely a blessing in disguise. These conditions reduced early-season water stress and likely allowed for more thorough phloem recovery. The cooler spring and summer temperatures were strong influences on the healthy, and sometimes excessive, canopy recovery this year.
Powdery Mildew
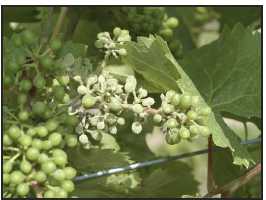
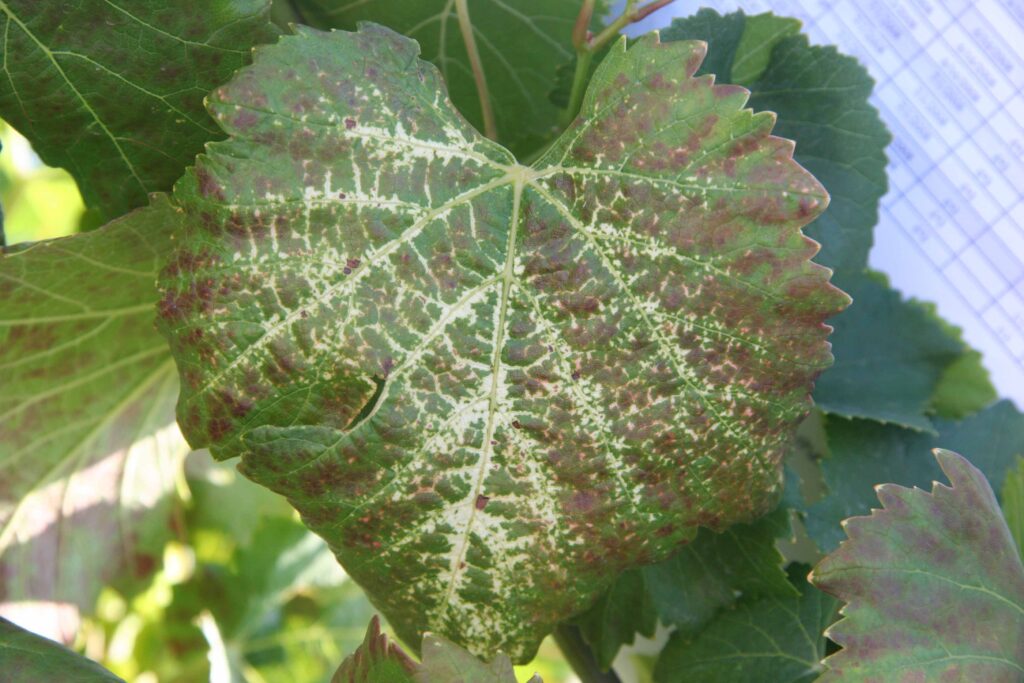
Powdery mildew control was also a challenge this year, due to near ideal temperatures and humidity in the region for most of the growing season. Cooler temperatures around bloom also slowed development, leaving clusters exposed in a susceptible state for longer than normal (Fig. 2).
The common denominators in most places experiencing loss-of-control were: (i) extended spray intervals, (ii) poor coverage, (iii) use of below -labeled rates, and (iv) less than desirable control last year.
Extended spray intervals leaves developing tissue exposed to potential infection. While extending these intervals may save a spray in a normal year (think hot and dry), 2011 was not normal. Just remember, that under optimal conditions, the powdery mildew fungus can reproduce every 5 days, so tight intervals, especially during bloom, are critical. Poor coverage and using low rates can result in the same thing: not having the proper amount of fungicide reaching the fungus.
Coverage is key in powdery mildew management, and appropriate rates make sure that there is enough product to control fungal development. Use appropriate canopy management techniques such as fruitzone leaf removal, to help with spray penetration. Use the highest labeled rates of a product if weather conditions are favorable for PM development.
As an added caution, continuous application of pesticides below labeled rates can lead to resistance development, especially if those products are considered “high risk”, and you are applying them successively. Remember to rotate fungicides with those of a different chemical class (called FRAC codes).
Poor control of canopy mildew the previous growing season, particularly after véraison, allows the fungus to build a reservoir of inoculum for the following year. This sets the stage for a high-risk year the next season. Post-harvest disease management in years with conducive weather conditions is a must.
Crown Gall
Reports of extensive crown gall outbreaks in vineyards have also been rolling in since early-mid August. Crown gall is caused by the bacterium Agrobacterium vitis, and the symptoms are characteristic plant “tumors”, or galls (Fig. 3). The galls eventually girdle the plant and cause vine collapse.
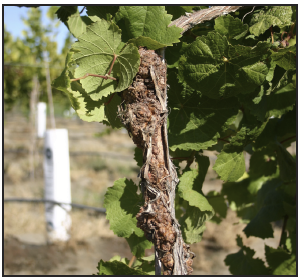
The bacterium can infect plants directly via causing lesions on roots, or through open wounds. Infections are often associated with winter or other forms of mechanical injury, or from contamination in nursery propagation beds. This is why obtaining cuttings from certified, reputable nurseries is of the utmost importance.
Due to the extensive winter damage in the state, it is no surprise that we are seeing high numbers of symptomatic vineyards. Vines that are infected will not only have visible galls (either milky white, to light brown, to black, depending on age), but will likely have a yellowing, stunted canopy, and fruit will be desiccated. Entire cordons or vines will display symptoms. The galls are perennial.
Unfortunately, there is nothing that can be done economically to control crown gall on a whole-block scale. Retraining to below the gall in individual vines is often done. However, if suckers were not retained this season, cutting back is not recommended until normal dormant pruning. If an extensive outbreak is seen in an individual block, replanting is an option, but remember that the bacterium can survive in/on root debris and in the soil, and fumigation to reduce the bacterial population may be necessary.
Conclusion
What a vintage it has been! With véraison closing in, and summer temperatures finally arriving, we are reminded that Washington is still the perfect climate for wine. But it is clear that Mother Nature likes to assert her authority every now and again. This was definitely her year.
AgWeatherNet Update
By Gerrit Hoogenboom, WSU Prosser
Global warming in Washington? Since I took the position of Director of AgWeatherNet in August of last year and moved from warm and balmy Georgia to Washington, people keep asking me if I have done “something” to the weather. First, we experienced the Thanksgiving freeze last year, followed by a cool spring and now a relatively cool summer.
Trust me; weather is not really something you want to mess with.
The weather stations of AgWeatherNet closely monitor the weather conditions across the state and hopefully many of you check the AgWeatherNet website on a regular basis. Our observations do indeed confirm that it has been cool and that it probably has been one of the coolest springs and summers since the first weather station was installed in 1988 (Fig. 1). Although this period only spans 23 years and is relatively short when evaluating local climate conditions, it does allow us to conduct comparisons with prior years.
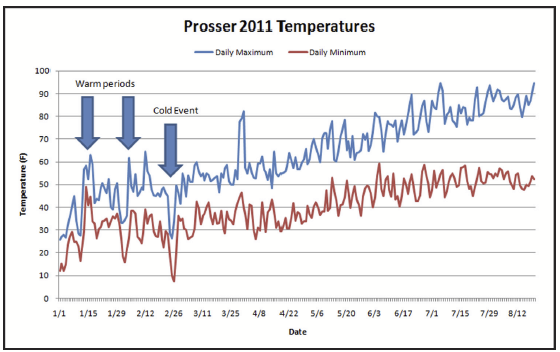
A summary for July for some of the key stations in the region can be found in Table 1. Wenatchee has been the coldest with an average temperature of 4.5°F below normal, followed by the Tri-Cities area which was 4.2°F below normal and Walla Walla which was 4.1°F below normal. Prosser was 3.7°F below normal and Moxee was 3.5°F below normal.
| Location (Period of Record) | Maximum (˚F) | Minimum (˚F) | Mean (˚F) | Anomaly (˚F) |
|---|---|---|---|---|
| Prosser (WSU IAREC; 1990-2011) | 83.6 | 51.8 | 68.6 | -3.7 |
| Mabton East (2009-2011) | 85.6 | 51.6 | 69.9 | NA |
| Port of Sunnyside (1993-2011) | 84.1 | 51.4 | 68.8 | NA |
| Moxee (1990-2011) | 83.4 | 46.2 | 66.5 | -3.5 |
| Mt. Vernon (WSU NWREC; 1994-2011) | 69.6 | 51.6 | 60.1 | -2 |
| Wenatchee (WSU TFREC; 1994-2011) | 82.5 | 56.6 | 70.4 | -4.5 |
| Gramling (Tri-Cities; 1989-2011) | 83.4 | 54.5 | 69.3 | -4.2 |
| Walla Walla (1993-2011) | 83.5 | 55.4 | 69.7 | -4.1 |
| Royal City East (2008-2011) | 81.6 | 54.3 | 68 | NA |
The plant is a great “integrator” of the local environment, especially soil and weather conditions. One feature that is frequently used to express this is “growing degree days” (GDDs) Growing degrees are the total number of degrees above a threshold value, which is 50°F for grapes. It is determined by calculating the average temperature and then subtracting the base temperature from the average temperature; a negative number will not be considered in this calculation and is usually ignored.
A summary for the GDDs accumulated since April 1 is shown in Table 2. A comparison is also provided with 2010, which was considered to be somewhat of a cool year, and 2009, a somewhat warm year. The average is based on the last four or five years, depending on the weather station location. The numbers clearly show what we all know: it has been cool since April. If your site is not shown in the table you can calculate your GDDs using one the tools on the AgWeatherNet website.
| Location | GDD: 2011 | GDD: 2010 | GDD: 2009 | GDD: Average |
|---|---|---|---|---|
| Prosser (WSU IAREC)* | 1436 | 1684 | 1939 | 1843 |
| Port of Sunnyside* | 1454 | 1758 | 2048 | 1883 |
| Walla Walla* | 1559 | 1782 | 2036 | 1967 |
| Mt. Vernon (WSU NWREC)* | 832 | 939 | 1096 | 944 |
| Paterson* | 1669 | 1952 | 2264 | 2142 |
| Outlook** | 1538 | 1849 | 2191 | 2005 |
| Mattawa** | 1694 | 1950 | 2228 | 2212 |
| Maryhill** | 1558 | 1849 | 2294 | 1989 |
| Benton City West*** | 1592 | 1946 | 2227 | 2081 |
AgWeatherNet will continue to closely monitor the growing degree days. Like many of you, we hope that the first freeze will be late this year!
Research Update: Mealybugs in Washington Vineyards
By Brian Bahder (PhD Student) and Doug Walsh, WSU Prosser
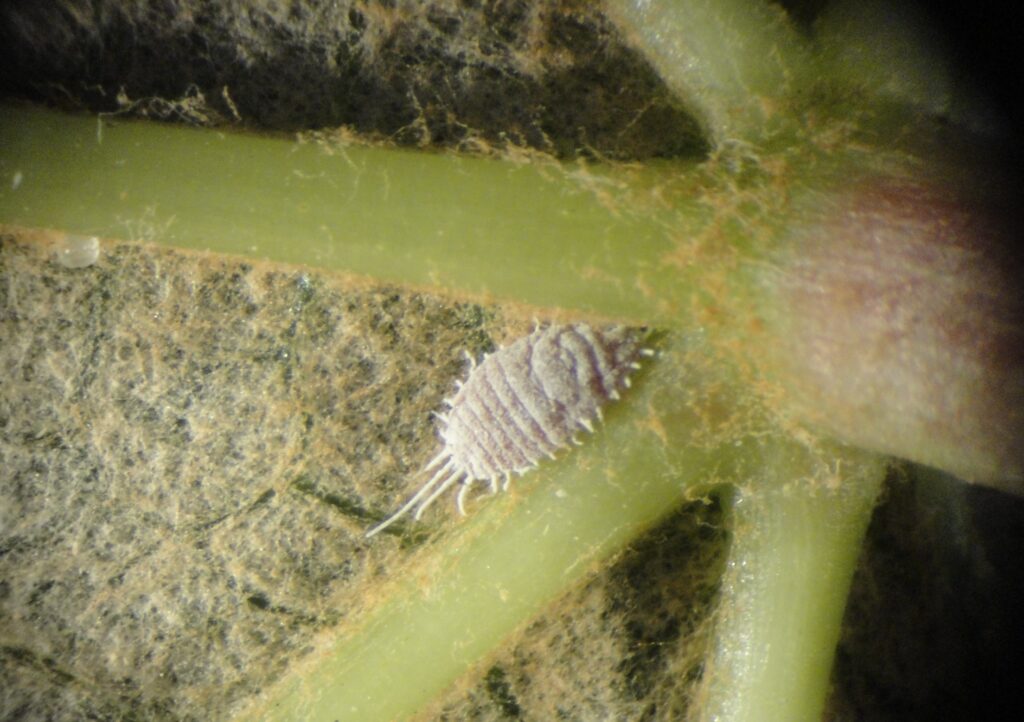
The grape mealybug, Pseudococcus maritimus (Fig. 1), was first reported in Washington State in 1950 by Kenneth Frick. Grapes in the lower Yakima Valley were infested, and the grape mealybug was found on other crops (pears, apricots) in subsequent years. The initial concern about the grape mealybug was focused on table grape production, where heavy infestations created large quantities of honeydew that resulted in sooty mold development. Sooty mold, and the presence of mealybugs in the grape clusters, reduces the marketability of the crop. Currently, direct damage is not the only concern for producers. Current research has demonstrated that the grape mealybug can transmit grapevine leafroll associated viruses (GLRaV-3). Grapevine leafroll disease can cause yield loss of up to 60%.
In 2007, the sex pheromone of the grape mealybug was isolated and became commercially available for vineyard monitoring. The availability of this pheromone thus lead to the development of a research projected focused on determining the flights timing of the grape mealybug in order to deploy more effective management strategies. Starting in 2009, Delta sticky traps (Fig. 2) with pheromone-imbibed septa were placed in both ‘Concord’ juice grape vineyards and in wine grape vineyards. The manufacturer-recommended trap density is 1 trap per 30 vineyard acres. For the experiment, traps were placed at densities of one, four, and eight traps per 30 acres, to determine the true density, and subsequent efficacy, of the traps.
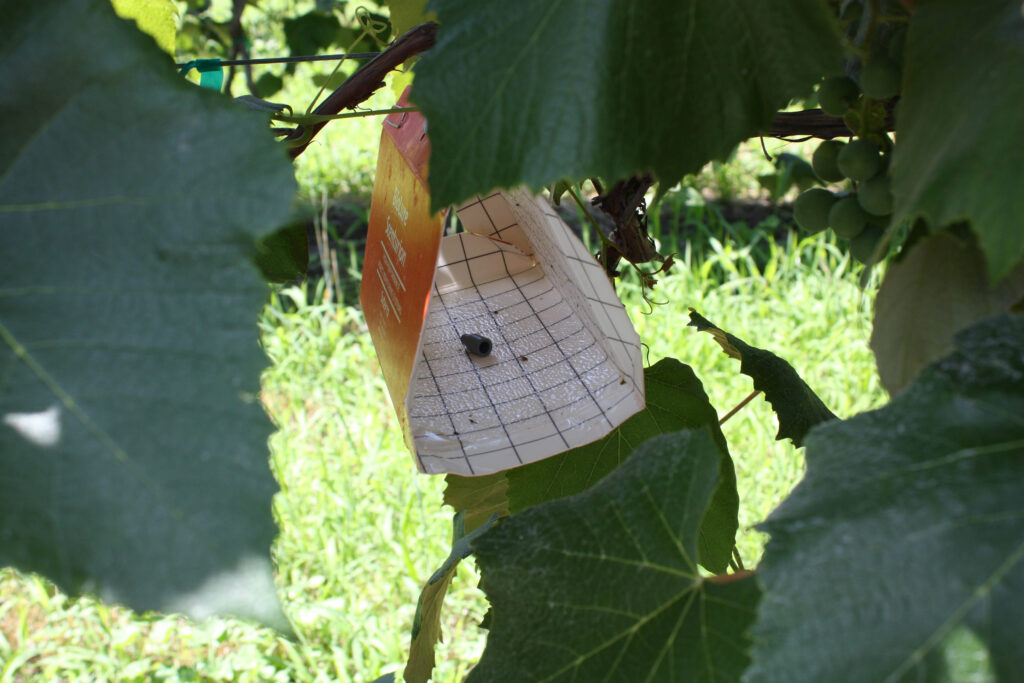
These traps were also used to determine: (i) the number of generations per growing season, (ii) when these generations peaked, (iii) when crawlers were emerging, (iv) the timing of first adult emergence, and (v) the flight distance of adult males.
In 2010, traps were collected weekly and the number of adult male mealybugs was recorded from 20 May until 27 Oct. Mealybug capture occurred during the first week of deployment.
In 2010, there were two generations of mealybugs. The first generation that emerged from the overwintering stage matured and had an adult peak period in the middle of June. The second generation emerged around the end of July and early August, with their peak flight period in mid August. The second flight lasted longer than the first, and adults were captured until mid October. At every site, the treatment with eight traps caught more males than the treatment with four traps, which caught more than the one trap treatment. The difference between the average number of mealybugs per trap in all treatments also followed this trend but to a lesser degree. These sites were in a randomized complete block design, and there could have been resulting competition between the treatments.
Traps that were placed outside of the vineyard to determine the flight distance of adult males had male captures at 300 to 600 ft away from the surrounding vineyards. Closer to the vineyard (300 ft), the males were clustered around the pheromone septa, indicating that they had controlled flight and were not randomly blown into the trap. Farther from the vineyard (600 ft) males were not clustered, suggesting they may have been blown into the traps.
In 2011 all traps were set up mid April in order to capture the first flight, and the first mealybug was captured the first week of May. In 2011, the experimental design was changed to a complete randomized design so that there was only one treatment per vineyard block, opposed to all three treatments in one vineyard. This will hopefully reduce confounding effects do to proximity of different treatments. Thus far, all sites have exhibited the same trend as last year with flight peak occurring mid June and no mealybugs present for most of July.
Vines were field sampled for crawlers and to monitor the rate of development. Based on the data from the first flight, there does not appear to be a difference in the average number of males per trap between the treatments using this new experimental design. This indicates that one trap is just as effective as eight traps for monitoring populations. To repeat the experiment for determining male flight distance, traps will be placed outside of vineyard research blocks, starting at 300 ft. They will be moved every week to get a more accurate idea of how far males are capable of flying.
Data provided from this research will hopefully provide useful information to help successfully monitor vineyards for grape mealybug infestations. It should also provide a time frame for when to treat for mealybugs, as treatments should be focused on control of crawlers, as that is when they are most vulnerable to insecticide applications.
Update on the Brown Marmorated Stink Bug
By Gwen Hoheisel, WSU Benton-Franklin County Extension
The Brown Marmorated Stink Bug (BMSB; Halyomorpha halys) was first detected in the United States in the mid 1990’s, but has recently made making national headlines because of the damage is has caused in commercial crops and homes on the East Coast. Everyone, from homeowners to commercial growers, is affected by this pest.
With a host list spanning everything from ornamental trees (e.g. walnut, maple, redbud), to vegetables (e.g. tomatoes, corn, asparagus), and fruit (e.g. small fruit, stone fruit, pome fruit), both gardeners and commercial growers have reason for concern. It’s feed habit can cause severe damage and distortion to developing fruit. Homeowners dislike BMSB because it will aggregate and overwinter in houses by the hundreds, much like the multi-colored Asian ladybug.
In 2010, researchers and master gardeners began to look for BMSB in western Oregon and Washington, and specimens were caught in the Portland-Vancouver area. In 2011, hundreds of traps (Figure 1) were deployed in both eastern and western Washington and Oregon by researchers, extension faculty, and master gardeners.
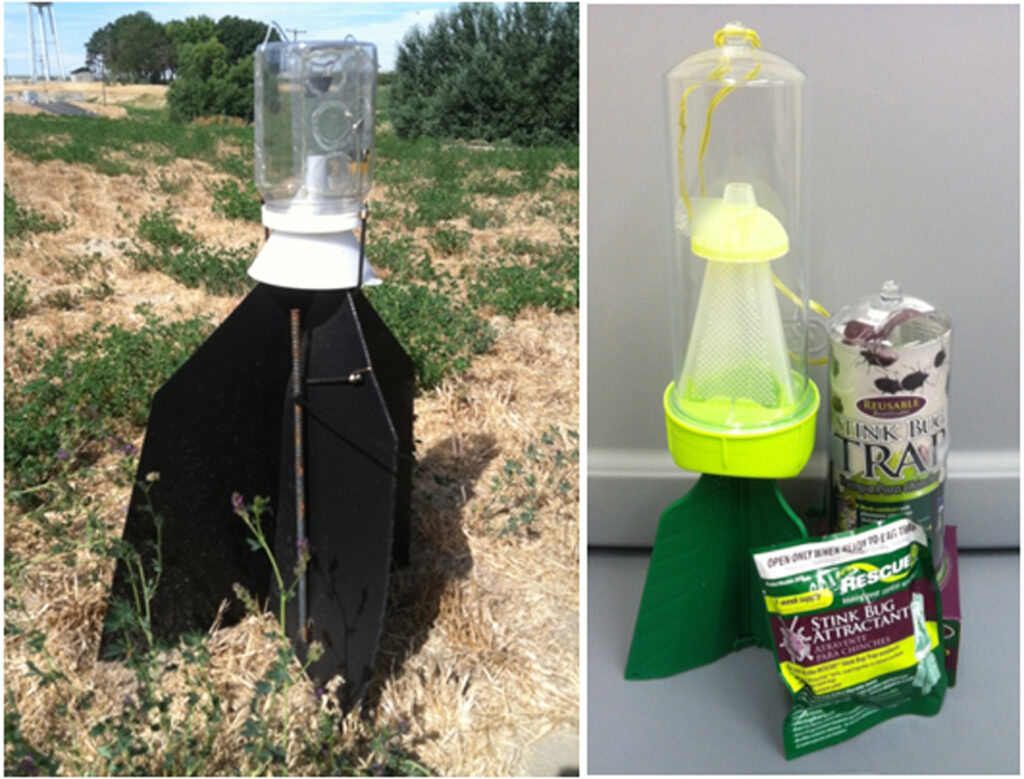
Based on experiences from the East Coast, the natural spread of BMSB is slow, but people can unwittingly transport the bug in vehicles and shipments. Therefore, our initial trapping is heavily focused on high risk areas like camp grounds, mini-storage units, and rest areas.
The complete lifecycle of BMSB in the PNW is still unknown. However, researchers believe that they will have one generation per year, as opposed to two generations that can occur in warmer climates.
Unlike native stink bugs, BMSB can complete an entire lifecycle in the vineyard or orchard. A benefit to this is that the immature nymph stage of the BMSB is more susceptible to insecticides, but timing and good coverage will still be critical for control.
Growers and crop consultants should familiarize themselves with the differences between native stink bugs and BMSB. BMSB has distinctly stripped abdomen and antennae as well as a smooth shoulder (i.e. no teeth or spikes) (Figure 2).
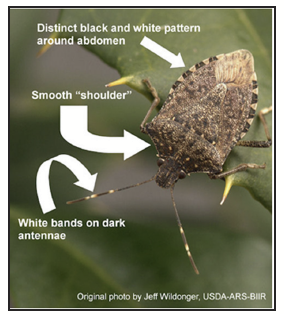
There are many native stink bugs that can have similar characteristics, but all of the aforementioned need to be present on the insect for positive identifcation of BMSB.
The Pest Management Transition Project has a useful online identification tool for stinkbugs that will help people distinguish between the natives and BMSB (http://pmtp.wsu.edu/BMSB.html).
No one knows when BMSB will invade vineyards. Optimistically, if the patterns of population growth in the PNW mimic those of the Eastern U.S., it could be several years before economic impacts are seen. However, first detection and monitoring is critical so that researchers can gain as much knowledge as possible before this becomes a larger problem.
If you suspect you have BMSB, bring adult specimens into your local extension office or research center.
Virus Update: The Status of Washington Vineyards
By Naidu Rayapati, WSU Prosser
In recent years, rapid expansion of the grape and wine industry in WA has predisposed its sustainable growth to debilitating virus and virus-like diseases. Since winegrape (Vitis vinifera) cultivars are clonally propagated to maintain trueness-to-type, and vegetative cuttings are used by growers for new plantings, viruses and virus-like agents have been primarily disseminated into new areas via movement of planting materials. Diseases caused by viruses and virus-like agents cannot be controlled by therapeutic agents (analogous to fungicides for controlling powdery mildew), therefore they must be controlled by prevention.
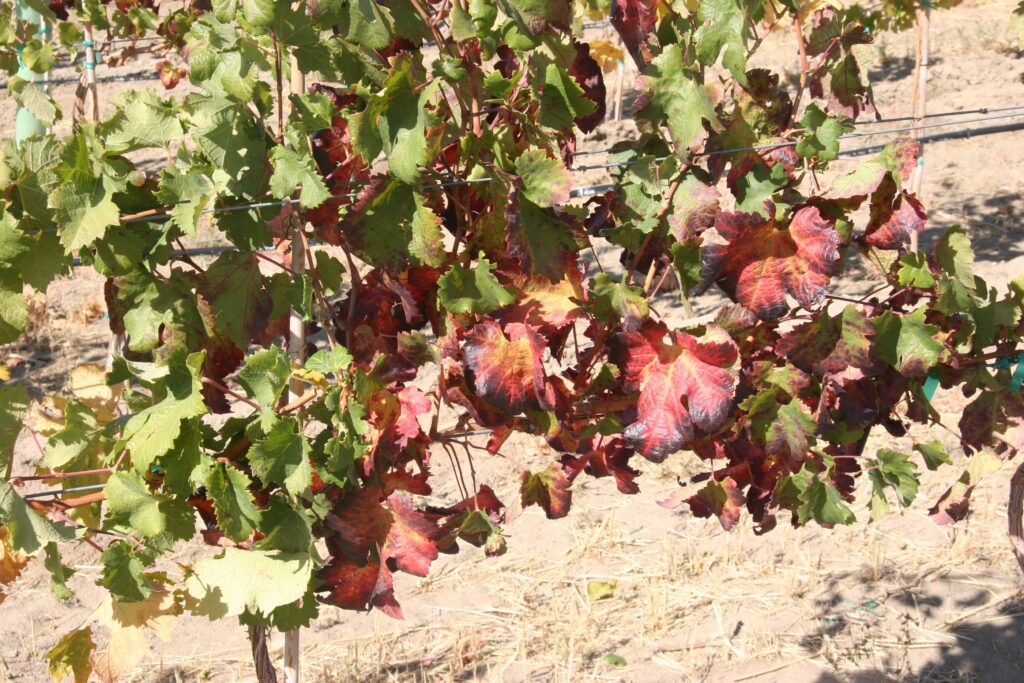
With this objective, the grape virology program at WSU-IAREC has been surveying grower vineyards for viruses since 2005. Since grapevine leafroll disease (GLRD; see Extension Bulletin EB2027E for details) has been recognized as a major constraint to wine grape production, surveys were conducted mainly for this disease in both red and white cultivars. In the case of red cultivars, leaf samples showing characteristic symptoms of grapevine leafroll disease (green veins and inter-veinal reddening and downward rolling of leaf margins) were collected between August and October every year.
Due to variation, leaf samples showing a wide range of discolorations were also collected. In some cases, leaf samples were collected from suspect grapevines, even though these vines were not showing any apparent GLRD symptoms. Since white cultivars do not exhibit typical GLRD symptoms, leaf samples were collected randomly from individual grapevines. In addition, vineyard blocks were monitored for symptoms caused by other viral diseases such as grapevine fanleaf. For this, vineyard blocks were monitored for fanleaf disease symptoms during June and July, since disease symptoms are more apparent during this time.
Approximately 2000 samples from different winegrape cultivars planted in 35 vineyard blocks were collected over a five year period between 2005 and 2009 and tested for the presence of grapevine viruses. The majority of these samples came from different American Viticultural Areas (AVAs) in the Columbia Valley and a few samples were from the Puget Sound AVA.
Samples were tested for different grapevine viruses. The sequences were compared with corresponding sequences of known grapevine viruses in GenBank (an online repository of genetic information) to precisely identify viruses and viroids present in the test sample. The data obtained from these studies were also analyzed to assess molecular diversity among different viruses and to document the incidence of mixed infections of grapevine viruses.
Among the ten grapevine leafroll-associated viruses (GLRaVs) reported worldwide, six GLRaVs (GLRaV-1, -2, -3, -4, -5, and -9) were detected during our surveys (Fig. 1). In addition, three viruses associated with Rugose Wood Complex (Grapevine rupestris stem pitting-associated virus [GRSPaV], Grapevine virus A [GVA], and Grapevine virus B [GVB]), grapevine fanleaf virus (GFLV; the causal agent of fanleaf disease), Grapevine fleck virus and Grapevine Syrah Virus 1 were detected in some wine grape cultivars exhibiting GLRD symptoms. Among the viruses documented so far, GLRaV-3 was found to be the most prevalent and widely distributed.
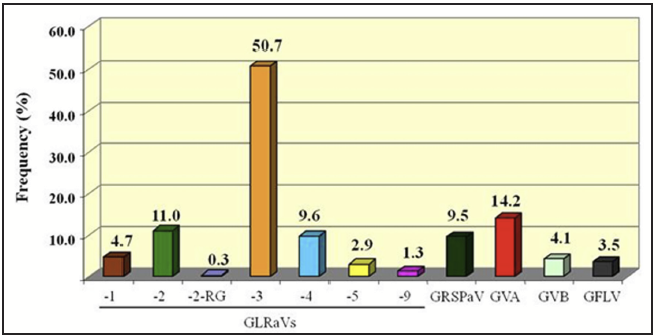
Further analysis of the data showed that many of these viruses are present in individual grapevines as single and/or mixed infections (Figs. 2 and 3). These mixed infections were found occurring in different combinations. It should be noted that the presence of other viruses is yet to be ascertained. Studies on genetic variability of natural populations of grapevine viruses such as GLRaV-1, GLRaV-2, GRSPaV and GFLV collected from different vineyard blocks showed the highly variable nature of these viruses indicating presence of genetically diverse isolates in WA vineyards.
In addition, a limited number of samples were tested for the presence of five viroids reported in grapevines worldwide. Australian grapevine viroid (AGVd), Hop stunt viroid (HSVd), Grapevine yellow speckle viroid-1 (GYSVd-1) and Grapevine yellow speckle viroid -2 (GYSVd-2) were detected in several wine grape cultivars affected with GLRD. Among them, HSVd was found to be widespread in different cultivars. GYSVd-1 was found to be the second most frequently observed viroid followed by AGVd and GYSVd-2.
Molecular analysis indicated that these four viroids are highly similar to those reported from other regions. These viroids may cause synergistic effects in mixed infections with other grapevine viruses. Although differences were observed in the frequency of AGVd, HSVd, GYSVd-1 and GYSVd-2, it should be noted that these results from a limited number of samples may not reflect the true picture of the presence of viroids in wine grape cultivars planted in the region. The economic impact of these viroids remains to be evaluated.
This is the most comprehensive study to date of grapevine viruses in WA vineyards. The results are benefiting certified nurseries and Northwest Grape Foundation Service located at IAREC in maintaining ‘clean’ planting materials for the benefit of the wine grape industry. It is important to note that monitoring for viruses and virus-like agents is essential to ensure vine health in our vineyards. The results have been shared with industry and regulatory agencies for increased knowledge of virus diseases and promotion of effective sanitation practices including planting of certified materials by growers.
Acknowledgements
This work was supported, in part, by WSU’s ARC and Extension Team-based internal competitive grant, Members of the Wine Advisory Committee of the WA Wine Commission, WSDA Assessment Funds, USDA-ARS Northwest Center for Small Fruits Research, USDA-NIFA Viticulture Consortium-West and USDA-NIFA SCRI Award No. 2009-51181-06027. Drs. Olufemi Alabi, Linga Gutha, Sridhar Jarugula, Gandhi Karthikeyan, Tefera Mekuria, Marilyn Soule, and Mr. Sudarsana Poojari have contributed to the data presented in this article.
Brix and Alcohol: A Simple Measurement?
By Jim Harbertson, WSU Prosser
Most of us are familiar with the conversion of sugar into alcohol during fermentation. However, with the advent of so-called “high Brix” winemaking, some winemakers are reporting conversion rates of sugar to alcohol during fermentation which are beyond theoretical values. So how is this possible? This article will discuss some of the factors that can lead to this mistake.
Theoretical conversion is based on the conversion of a single 6-carbon sugar (glucose), to two each of ethanol and carbon dioxide. The theoretical yield of ethanol is 51.1% by weight and 65% by volume. There is the opinion that theoretical yields are lowered to 43-47% weight and 54-59% by volume, due to yeast formation of other composed used to survive the ethanol environment they produce. This opinion, however, needs to be considered in context: the ability of different yeast strains to survive ethanol toxicity does varies, but the variance among most popular yeast strains sold only is only 0.5% of extra ethanol, and the typical maximum limit of ethanol produced is ~14.5% (v/v).
The most popular equation to calculate conversions assumes that the majority of soluble solids in grapes is sugar (glucose and fructose). This is optimistically calculated as soluble solids (Brix) x 0.51. Some equations attempt to account for other solids (not sugars) that contribute to Brix measure, but this is variable (dependent on vintage, variety and vineyard). Additionally, because ethanol evaporates during fermentation and barrel aging, the basic conversion ratio between sugar and ethanol is transient in nature.
Getting the initial soluble solids measurement correct is often one of the first areas of error. Sampling can be difficult in large acreage vineyards due to variability in ripening. Many wineries use the harvest measure of Brix as a guide to what to expect in the tank. However, in most cases, Brix measured after crushing is quite different than that taken at harvest, likely due to a lapse in time from crushing to measurement (often waiting overnight after crushing, and taking the sample in the morning). This can translate to a small amount of ethanol being produced, as fermentation has already begun. Measures of soluble solids by density meters are relatively insensitive to the presence of ethanol, and this can be problematic. Measures in our lab have shown that under controlled conditions, sugar that normally measure 25 Brix would measure about 24.1 Brix with 2% (v/v) ethanol present. It seems completely unlikely that 2% (v/v) ethanol would be produced in an evening just after crushing, but 0.5% (v/v) would be within reason. This, of course, would alter your conversion ratio considerably because you would still think the initial Brix was unchanged (even though in practical terms, you have less Brix).
An additional mistake is assuming all of your fruit was adequately crushed. One difficulty in dealing with high-Brix fruit, is that it tends to only partially crush, even when it goes through a conventional destemmer-crusher. As the fruit begins to get overripe (fruit naturally stop accumulating sugar after 25˚Brix, additional sugar comes from dehydration), it can shrivel and these shriveled berries become more difficult to crush because of reduced turgor pressure. This results in whole berries slipping through the rollers of your crushing mechanism. When this happens, it may cause an underestimation of sugar concentration, as these whole berries will break and release sugar at different times during the winemaking process. Some wineries even complain of significant sugar increases after pressing because of the high number of unbroken berries in the ferment.
The advent of more specific measures of sugar evaluation such as glucose and fructose has added an extra level of interest. Typically, measures of glucose and fructose are done at the end of fermentation to measure residual sugar. It can also be done to evaluate troublesome ferments, as yeast tend to be glucophilic and leave more fructose behind. Some wineries have begun measuring the glucose to fructose ratio in the fruit and have noticed that the ratio tends to slightly favor fructose.
The berry accumulates fructose and glucose on a 1:1 ratio (from sucrose) and does not have any preferential use of either sugar. So the ratio in the either the fruit samples or after crushing, can be used as a means to determining if fermentation in your sample or tank has begun. Since yeast will preferentially transport glucose inside their cell, a higher fructose to glucose ratio would indicate that fermentation has begun.
Finally, there are methods (distillation, gas chromatography, infra red) for measuring ethanol in the presence of sugar, which can provide you a measure of the initial alcohol in your tank. Even with all of the aforementioned variables, these methods will still only provide an estimate, since they cannot account for potential released sugar in unbroken berries, or ethanol evaporation during fermentation and storage.
In conclusion, one of the simplest relationships that enologists have used for years has become more complex with the advent of “high-Brix” winemaking. Several factors can lead to the miscalculation of greater conversion rates of sugar to alcohol than theoretically possible. Measuring the glucose to fructose ratio can be used as an indicator that fermentation has begun in fruit or in tanks, and initial measures of ethanol can be used to help remedy the situation.
Legal Status of Yeast Nutrients Changed
Winemakers have sometimes used yeast nutrients to limit risks associated with problem alcoholic fermentations. Available from technical suppliers, nutrients are commonly sold as proprietary blends containing a nitrogen source (frequently diammonium phosphate), vitamins, minerals, and other ingredients. However, some of these blends were technically illegal for use in the USA. Although the ingredients were considered to be generally regarded as safe (GRAS), most were not included on the list of materials legal to treat grape wine maintained by the Trade and Tobacco Bureau (TTB).
Supported by the WA Wine Advisory Committee and others, the lab of C.G. Edwards has conducted experiments over a number of years to determine optimal concentrations of vitamins important for Saccharomyces. Such nutrients included biotin, pantothenic acid, thiamin, and pyridoxine. With this supporting evidence, a petition was recently prepared to the Trade and Tobacco Bureau (TTB) to approve the use of these nutrients. As of August 1, 2011, TTB approved the petition, and these vitamins may be legally used to assist fermentation in the USA. For the list of approved materials, please see (http://www.ttb.gov/wine/wine_treating_materials.shtml).
Thank you to the WA Wine Advisory Committee, American Vineyard Foundation, Lallemand Inc., and others for support of this research as well as all the individuals involved in this work (J.K. Fellman, K.M. Hagen, A. Ortiz-Julien, J.P. Osborne, G. Specht, L. Van de Water, X.-D. Wang, and others).
Maceration Part 1: Focus on Phenolics
By Federico Casassa (PhD Student), and Jim Harbertson, WSU Prosser
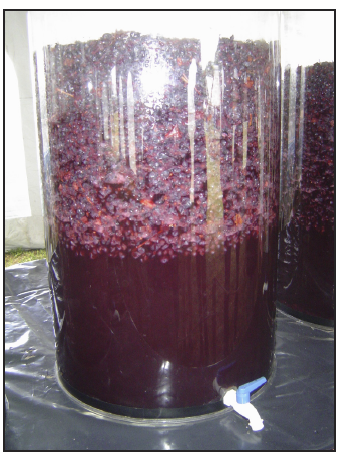
skins and seeds with juice during red winemaking (Fig. 1), is an intriguing aspect of modern Enology. Maceration is recognized as a critical step in defining wine style, but some fundamental questions still remain: What substances are extracted and what are their impact?; How do these compounds evolve over time and interact with each other?; and How does this evolution influence the wine style?
This article, the first in a series on maceration, will focus on phenolics.
Extraction and Evolution of Phenolics during Maceration
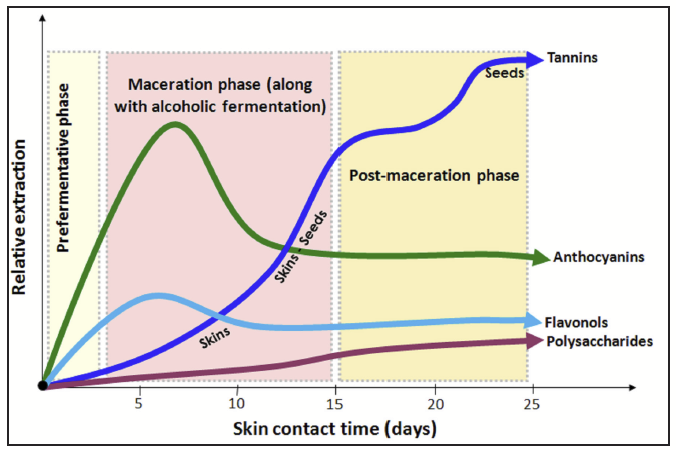
The maceration process can be divided into three distinct phases. Figure 2 show these phases as a function of skin contact time, along with the theoretical extraction of anthocyanins, tannins, flavonols and polysaccharides during red wine maceration.
Anthocyanins.
Anthocyanins are monomeric (Greek monos=one, meros=part) and glycosilated compounds (Greek glukus=sugar, i.e. with a glucose molecule attached) located in the grape skin. They are responsible for color, and possibly, modulation of astringency upon reaction with tannins [1].
Anthocyanins are also highly sensitive to pH: only 20-25% of the total available anthocyanin pool displays the typical red color at wine pH, the rest are in uncolored forms. Maximum extraction is typically observed between the 4th and 5th day of skin contact [2], but this can occur earlier (e.g. Malbec) or later (e.g. Pinot noir).
In addition to time, temperature also plays a major role in anthocyanin extraction. Maceration is a diffusion-driven process, with the diffusion rate of anthocyanins (and most phenolic classes, for that matter) increasing almost linearly between 60 to 95°F.
Anthocyanins, by virtue of the sugar attached to them, are water-soluble molecules, and in the situation of cold-soaking, up to 70% of the extractable anthocyanins can be recovered in the wine.
A sharp decrease in the concentration of anthocyanins is observed during post-maceration (Fig. 2), due to degradation reactions and to an electrostatic phenomenon leading to the absorption of these pigments into yeast cells, skins, and seeds. Recently, we have found that under extended maceration conditions, such decrease in monomeric anthocyanins can be partially explained by the incorporation of these monomers into polymeric pigments [2] (Greek poly=many).
Tannins.
The term “tannin” is often used loosely to describe a class of phenolic compounds able to precipitate proteins (such as the ones found in human saliva), thus eliciting the tactile sensation called “astringency”. These are located in both grape skins (about 20%) and seeds (about 80%) and can be monomers, oligomers (Greek oligos=a few, i.e. composed by more than one but less than five units) or polymers.
Tannins react with anthocyanins during aging, resulting in color stabilization and the observed “mellowing” of wine astringency with aging. The extraction of these compounds is complex and their interaction with anthocyanins, pectins, and polysaccharides is still not fully understood. In the first stage, when the fermentation medium is essentially aqueous, skin tannins are predominantly extracted. Sensorially speaking, lower molecular weight skin tannins are slightly bitter and astringent, whereas polymers of about 30 units are more astringent than smaller skin tannins. The first stage of tannin extraction is followed by a second “transition” stage, under increasing ethanol levels, which continues the extraction of skin tannins together with the initiation of seed tannin extraction. There is still a third phase, post-maceration, in which the extraction driven by seed tannins [3].
Seed tannins are chemically different from skin tannins in that they are shorter (from monomers up to 8 or 9 units). Sensory-wise, seed tannins are bitter in the case of monomers and certain dimers, and also more coarse and astringent than skin tannins of similar size.
Contingent upon variety and maceration technique, it is estimated that from the initial pool of tannins present in the berry, only 10 or 20% of it is extracted [4]. From these, 60 or 65% come from the seeds while the skins contribute with the remaining. Therefore, more than half of the tannin content of wine (and thus much of its astringency) comes from the seeds.
There is still much to be learn about the chemical fate of tannins during winemaking. Recent research conducted at UC-Davis, WSU, and the Australian Wine Research Institute is unveiling several new dimensions on the chemistry of these compounds.
Contrary to popular belief, it appears that it is just the tannin concentration itself, and not the origin of the tannin, that explains perceived astringency. Second, the extraction of seed tannins can range from 5 up to 65% [4], suggesting that large differences on the wine tannin content may be explained by a higher or lower extraction of seed tannins. In fact, under extended maceration conditions, up to 80% of the tannin pool available in the seeds can be extracted.
Finally, it appears that when it comes to tannins, it is not all about extraction. Indeed, the cell walls of the berry mesocarp (flesh) can absorb large amounts of tannins. The ethanol, which is present towards the end of alcoholic fermentation, may aid the desorption of them from the cell walls [4]. Consequently, it is thought that desorption is what drives the documented “over-extraction” of these compounds at the end of an extended maceration.
Flavonols.
Located mainly in the skin, these are light-yellow planar molecules. At concentrations above 200 mg/L they can elicit bitterness and a mild astringent response. Although the initial flavonol pool in grapes can be high, under practical winemaking conditions no more than 50-60 mg/L are actually extracted [2].
Flavonols are also involved in a phenomenon known as “copigmentation”, protecting anthocyanins from being discolored (e.g. by effect of pH swings) or from oxidation.
Polysaccharides.
These are heterogeneous mixtures of proteins and polymeric carbohydrate structures that can readily interact with polyphenols. Located both in the grape and yeast cell walls, polysaccharides and mannoproteins are among the highest molecular weight compounds in wine, with well-documented effects as protective colloids and as (beneficial) modulators of astringency.
Early during maceration, these compounds are extracted primarily from the berry cell walls. Maximum extraction, however, is attained after alcoholic fermentation and during aging, contingent upon autolysis (Greek autos=self and lysis=breakdown) of Saccharomyces cerevisiae cells [5].
Conclusion
Maceration is the most decisive phase for phenolic management in red wines and defines wine style. Since so many variables come into play, winemakers focus much of their technical efforts on those 8, 10 or 20 days of maceration.
Skin contact time and temperature are arguably the two most important variables, readily altering the proportions of the major phenolic classes that end up in the wine. Knowledge of the underlying physical and chemical processes that occur during maceration allows the winemaker to adapt this process to the style of wine that is being sought and ultimately, to what consumers expect to find in the glass.
This article is one in a three part series. Please see future VEEN issues for Part 2: Color Evolution, and Part 3: Focus on Aroma.
References
- Cheynier, V., et al. 2006. Structure and properties of wine pigments and tannins. AJEV 57:298-305.
- Casassa, L.F, et al. 2011. Unraveling the effects of extended maceration in Merlot wines with different ethanol levels. Proc. Am. Soc. Enol. Vit. Annual Meeting, Monterrey, Cal. pp 70.
- Harbertson, J.F., et al. 2009. Chemical and sensory effects of saignée, water addition, and extended maceration on high Brix must. AJEV 60:450-460.
- Adams, D.O., and Scholz, R.C. 2008. Tannins – the problem of extraction. Proc. 13th Australian Wine Industry Tech. Conf. Aus. Soc. for Vit. and Oenology. Adelaide, Aus. pp. 160-164.
- Guadalupe, Z., Martínez, L., and B. Ayestarán. 2010. Yeast mannoproteins in red winemaking: effect on polysaccharide, polyphenolic, and color composition. AJEV 61:191-199.
- Zamora, F. 2003. Elaboración y crianza del vino tinto: Aspectos científicos y prácticos; AMV Ediciones, Mundi-Prensa: Madrid, España, 225 pp.
Program Update: Wine Sensory
By Carolyn Ross, WSU Pullman
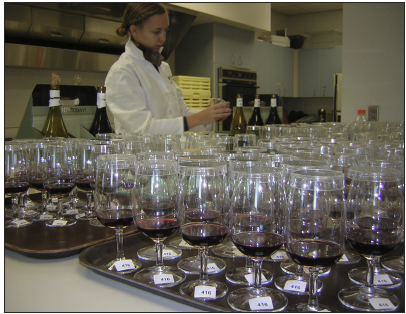
The sensory and analytical facilities have been a busy place in the School of Food Science in Pullman! Below are descriptions of three wine research projects that are currently being conducted in the Ross lab.
Effects of Tannin and 4-Ethylphenol and 4-Ethylguaiacol on Sensory Properties of WA Cabernet Sauvignon and Syrah
Brettanomyces bruxellensis (“brett”) contamination is often considered a wine fault. “Brett” contamination is associated with increased concentrations of 4-ethylphenol (4-EP) and 4-ethylguaiacol (4-EG) in the wine. These compounds have been linked with negative sensory properties including increased “Band-Aid”, “barnyard” and “medicinal” aromas, with the suppression of fruity attributes.
The first objective of this study was to determine a ratio of 4-EP to 4-EG that would lead to consumer rejection of WA Syrah and Cabernet Sauvignon wines. In these wines, two consumer panels (n=50) were conducted that evaluated three ratios of 4-EP to 4-EG: 1:4 (100µg/L 4-EG: 400µg/L 4-EP), 1:8 (100µg/L 4-EG: 800µg/L 4-EP) and 1:12 (100µg/L 4-EG: 1200µg/L 4-EP). For both wine varietals, a significant decrease in consumer preference was observed at the 1:8 ratio, suggesting consumer preference of 4-EP and 4-EG is between the 1:4 and 1:8 ratios.
As wine composition may influence 4-EG and 4-EP perception in red wine, the second objective was to determine the impact of tannin concentration on the wine sensory attributes. Syrah and Cabernet Sauvignon wines were spiked at 1:8 ratio of 4-EG:4-EP, with grape tannin added at 500, 1000 and 1500 mg/L catechin equivalents. Trained panelists evaluated these wines for medicinal, spicy, leather and fruity aroma intensity. In Cabernet Sauvignon, increased tannin concentration resulted in increased medicinal and lower fruity aroma intensity.
Sarah Michaux is the MS student involved with the project, along with collaboration with Dr. Charlie Edwards. She gave an oral presentation of her research at the 2011 American Society of Enology and Viticulture Annual Meeting.
Perception of Wine Finish in White Wines
Wine finish is defined as the lingering taste that follows the swallowing of wine. It is believed that certain flavors are associated with the length of the wine finish, with fruity/floral flavor associated with shorter finish and oak, spice, and earthy flavors associated with a longer finish.
Finish is also said to be closely related to wine quality, with a longer finish associated with higher quality wines. However, these associations between wine finish and flavor and quality have not been approached in the scientific literature. The objective of this study was to determine how finish varies with the presence of various flavor compounds in white wine, and to relate the concept of finish to consumer acceptance.
Using time intensity methods, a trained panel (n=10) determined the perception of finish for four different flavor compounds in a model wine and white wine system. These compounds included ethyl hexanoate (fruity), linalool (floral), oak lactone (oaky), and 1-octen-3-ol (mushroom). The time-intensity results showed that the four compounds finished at different times, with the time required to reach maximum intensity being shorter for fruity/floral compounds and longer for the mushroom and oaky flavors.
Duration of the perception was also shorter for the fruity/floral compounds compared to the other compounds. Following trained panel evaluations, consumers (n=60) evaluated three commercial WA Chardonnay wines that varied in the application of oak during winemaking. Results showed that consumers found a difference in finish between the “no oak” Chardonnay and the heavily oaked Chardonnay. This study provides the first rigorous examination of wine finish and its relationship with both the presence of different flavor compounds and consumer acceptance.
Emily Goodstein is the MS student currently involved with this project. This study will be presented at the 2011 Pangborn Sensory Symposium (Toronto, ON). Emily is currently employed at Milne Fruit in Prosser, WA.
Impact of Wine Matrix Components on the Aroma and Flavor Perception of Red Wine
The objective of this research project is to examine the interaction of wine matrix components, particularly ethanol, on the chemical and sensory properties of red wine. To address this research question, a number of graduate students have worked various aspects of this project.
Medy Villamor (Ph.D) has examined model wines and the impact of wine matrix on the recovery of eight aroma compounds. The model wine varied in its composition of ethanol, fructose and tannin concentration. All of these matrix components were involved in complex interactions impacting the recovery of the aroma compounds. Although both fructose and tannin levels influenced the recovery of odorants in model wine solutions, their impact was heavily dependent on the level of ethanol. Higher ethanol, tannin and fructose levels favored retention of larger, hydrophobic aroma compounds. Thus the lowest concentration of odorant in the headspace was found in the presence of high fructose and tannin at 16% ethanol.
These interactions are important as they may reduce the perception of these aromas in wine during sniffing and consumption. Collaborating with Drs. Charlie Edwards and Jim Harbertson, Medy has presented her research at several scientific meetings, including Washington Association of Wine Grape Growers and the 2010 and 2011 Annual Meeting of the American Society of Enology and Viticulture.
Moving beyond a model system, this project has also sought to answer the question of differences in chemical and sensory properties in an actual wine. To this end, the impact of watering back and saignee on the final properties of the wine were examined.
Wine prepared: Treatment 1 was a control (no treatment applied, 27°Brix). Treatment 2 was a watered back treatment, adding water to the must to 23°Brix. Treatment 3 involved first watering back the must to 23°Brix, followed by the addition of sucrose to raise the sugar back to the original 27°Brix. Treatment 4 was a watered back treatment, adding water to bring the °Brix down to 19°Brix. Treatment 5 was watered back to 19°Brix, with sucrose added to raise the °Brix back to the original 27°Brix.
The wine treatment significantly impacted the final ethanol concentration of the wine, with ethanol concentrations ranging from 15.7% in the control treatment to 12.2% in the 19°Brix treatment. Sensory difference testing showed that consumers were able to distinguish between the treatments. In consumer acceptance testing, differences in aroma, astringency and alcohol burn acceptance were found, with lower acceptance for the control wine.
Trained panel evaluation of these wines showed that watering back increased the intensity of some attribute aromas (nutty notes) but decreased the intensity of other aromas (vegetal, caramel and spicy notes), bitterness and alcohol burn. Further, the impact of saignee and watering back was also examined in wines that were industrially prepared.
Among the treatments, control (22°or 23˚Brix), bleed to 7% and bleed to replace, trained panelists were able to identify specific aroma and flavor differences while consumers displayed differences in acceptance.
The results suggested that the sensory modifications that saignee and watering back techniques have on the final wine may improve consumer acceptance with regard to certain attributes. Taken together, these results demonstrate the influence of ethanol and other matrix components on aroma compound recovery, sensory aroma threshold and consumer acceptance of specific wine sensory attributes.
Allison Beall and Anne Secor are the MS students who worked on this aspect of the project. This research has been presented at the Washington Association of Wine Grape Growers Annual Meeting. Allison is currently employed at Commercial Creamery (Spokane, WA).
Studies continue in the sensory evaluation lab. Please give me a call (509-335-2438) or send me an e-mail (cfross@wsu.edu) if you have any questions or would like to be a participant in the studies.