Growing Degree Days
In-season grapevine development is strongly influenced by air temperature. Growing Degree Days (GDD) is a useful unit to measure temperature in the growing season. The summation of daily GDD units can be used for a variety of things: comparing one region to another, comparing one season to another, and predicting important stages in vine development (bloom, veraison, and maturity).
GDD is calculated from a base temperature, can be in °F or °C, and can be summed over different periods of time. Washington State University calculates all GDD in °F, with a base temperature for grapes at 50 °F. We calculate season total GDD from April 1 through October 31.
Below are charts of accumulated GDD for the Yakima Valley for the current season, and for long-term average GDD across AVAs in Washington. All data is from AgWeatherNet. You can use AgWeatherNet to create your own, station-specific GDD charts.
2026 Cumulative GDD — Yakima Valley AVA
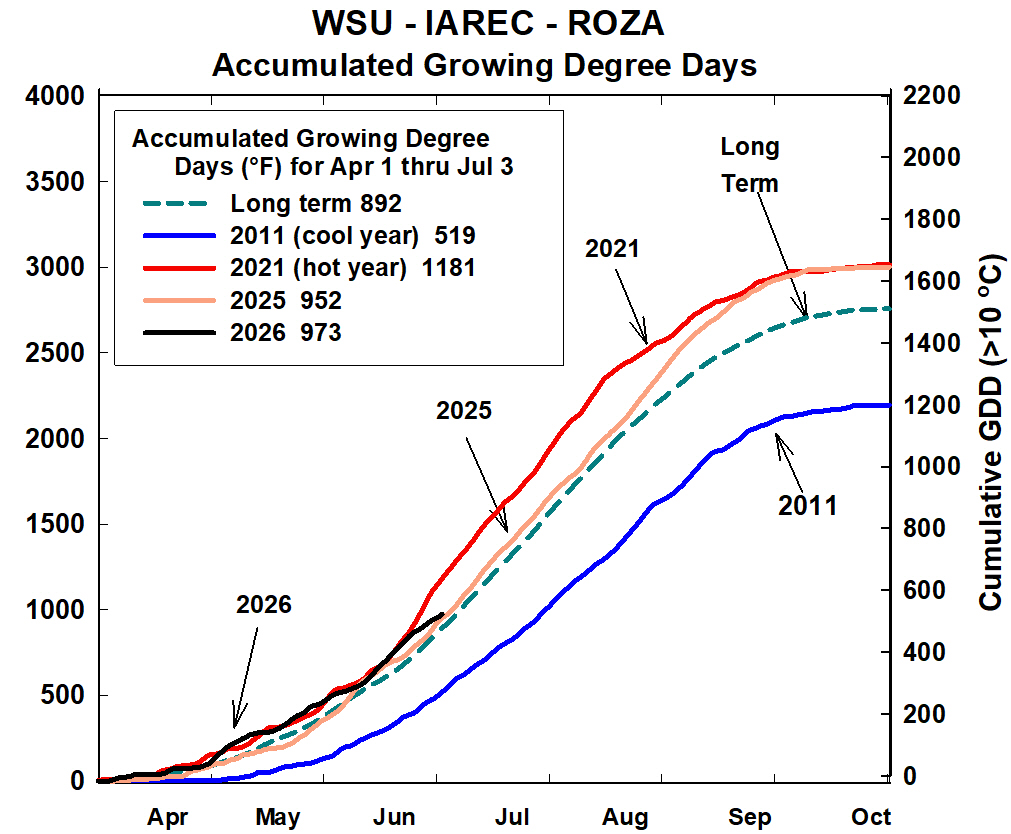
The seasonal accumulation of growing degree days, base 50 degrees Fahrenheit as measured at the WSU Prosser ‘ROZA’ AgWeatherNet Station. A secondary chart axis also presents growing degree day units base 10 degrees Celsius. Reported units are based on the 50-degree Fahrenheit calculation. Growing Degree days are accumulated from 1 April to 31 October each year.
The long-term average accumulated growing degree day units by July 3 were 892 degrees Fahrenheit. In 2011, a cool year, the accumulated units were 519 and in 2021, considered a hot year, the accumulated units were 1181 by July 3 . The GDD units for 2025 were 952 and the accumulated GDD units in 2026 are 973 by July 3.
Cumulative GDD at WSU Roza
| Year | Accumulated GDD (April 1 to October 31, 50°F base) |
|---|---|
| Long term average | 2759 |
| 2011 | 2195 |
| 2021 | 3015 |
| 2025 | 3000 |
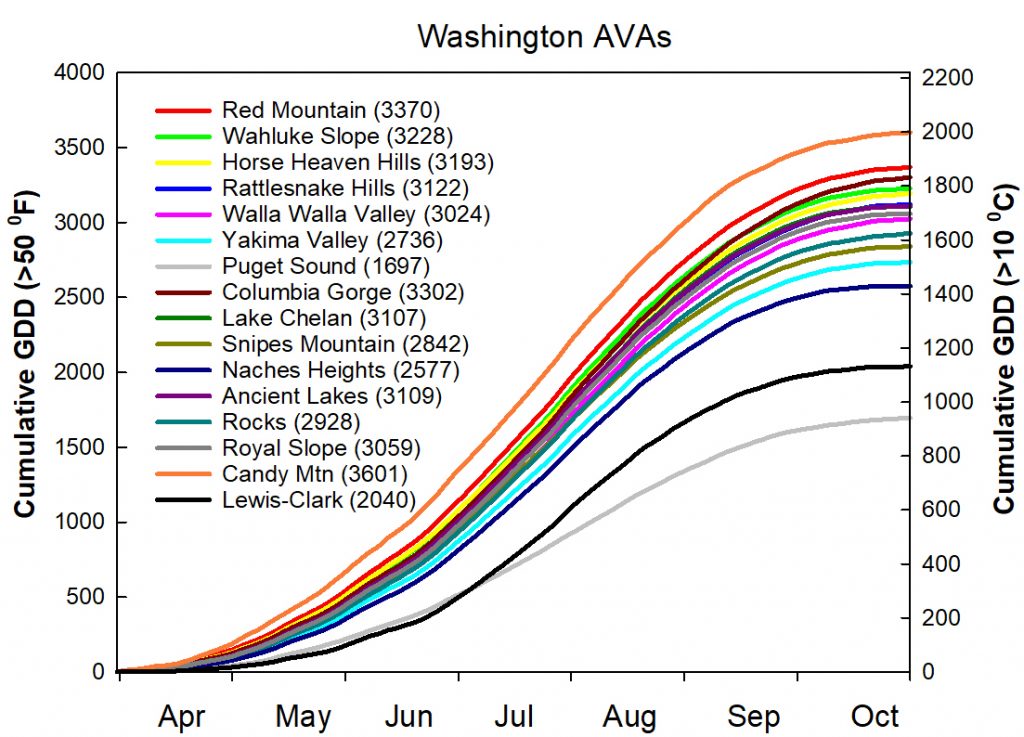
The long-term average seasonal accumulation of growing degree days, base 50 degrees Fahrenheit as measured at different WSU AgWeatherNet weather stations, representing the different Washington American Viticultural Areas. Growing Degree days are accumulated from 1 April to 31 October each year. Red Mountain is 3370 units. Wahluke Slop is 3228 units. The Horse Heaven Hills is 3193 units. The Rattlesnake Hills is 3122 units. The Walla Walla Valley is 3024 units. The Yakima Valley is 2736 unites. The Puget Sound is 1697 units. The Columbia Gorge is 3302 units. Lake Chelan is 3107 units. Snipes Mountain is 2842 units. Naches Heights is 2577 units. Ancient Lakes is 3109 units. The Rocks District is 2928 units. Royal Slope is 3059 units. Candy Mountain is 3601 units, and Lewis-Clark is 2040 units.
Precipitation
Precipitation is critical in replenishing winter soil moisture in irrigated eastern Washington. See the annual precipitation record for the Yakima Valley AVA below, and how it compares to the long-term average. For precipitation values for other locations in the state please visit AgWeatherNet.
Current Year Cumulative Precipitation — Yakima Valley AVA
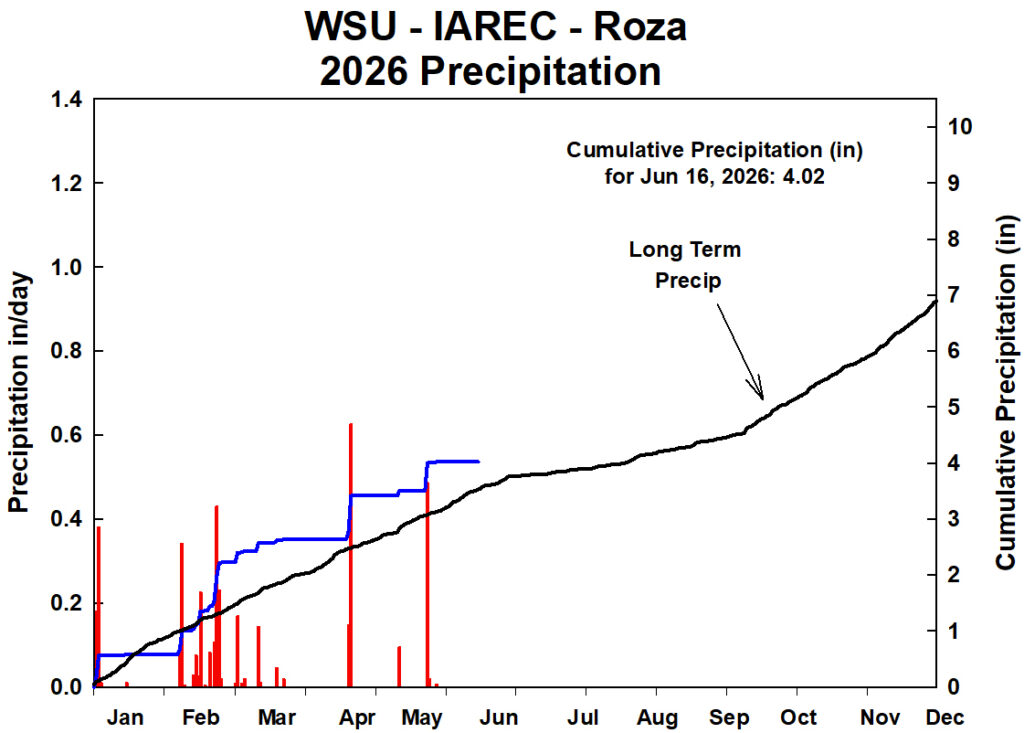
The seasonal precipitation pattern and accumulation as measured at the WSU Prosser ‘ROZA’ AgWeatherNet Station from January 1 to December 31. Chart axis presents units in both inches and millimeters, but actual values are reported in inches.
Individual red bars indicate which days in 2026 that precipitation fell. Average daily precipitation rarely exceeds 0.4 inches of rain, and usually very little precipitation falls between May and August. This is seen in a long-termaverage precipitation curve denoted in black, which shows the most accumulated precipitation falls between January and May, and again in September to December. The accumulated precipitation from January 1 until April 22 2026 was 2.8 inches.
Long-term Average Cumulative Precipitation – All AVAs
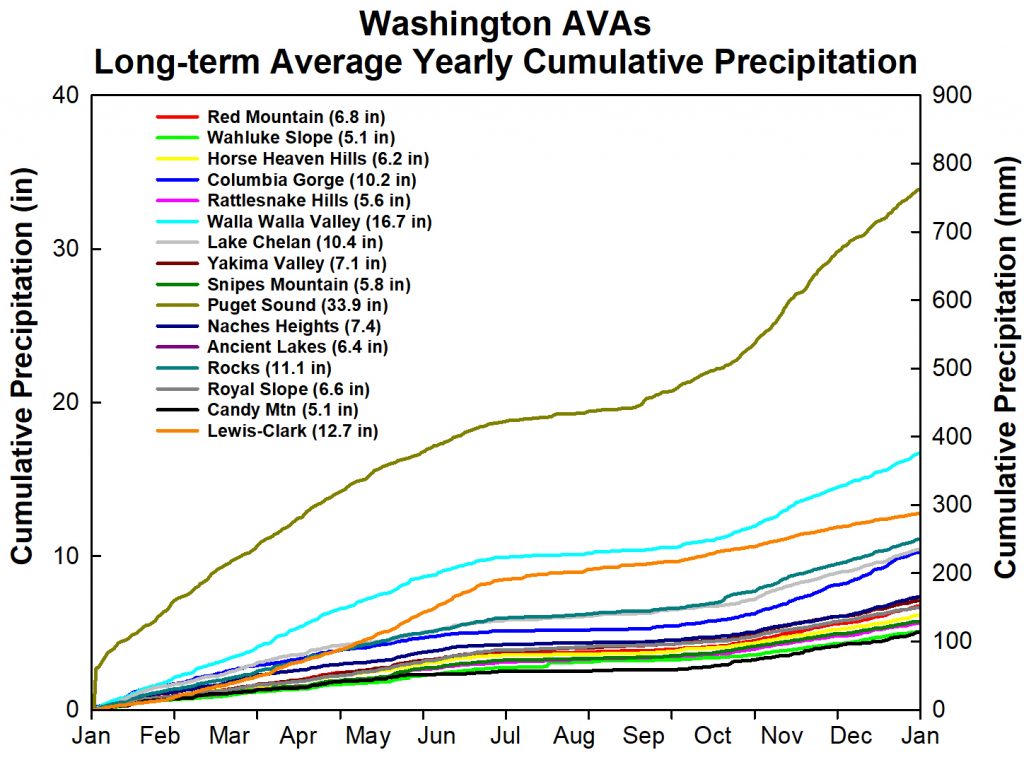
The long-term average seasonal accumulation of precipitation at different WSU AgWeatherNet weather stations, representing the different Washington American Viticultural Areas. Precipitation is accumulated from 1 January to 31 December. Chart axis has units in both inches and millimeters, but reports actual values in inches. Red Mountain is 6.8 inches. Wahluke Slop is 5.1 inches. The Horse Heaven Hills is 6.2 inches. The Columbia Gorge is 10.2 inches. The Rattlesnake Hills is 5.6 inches. The Walla Walla Valley is 16.7 inches. Lake Chelan is 10.4 inches. The Yakima Valley is 7.1 inches. Snipes Mountain is 5.8 inches. Puget Sound is 33.9 inches/ Naches Heights is 7.4 inches. Ancient Lakes is 6.4 inches. The Rocks District is 11.1 inches. Royal Slope is 6.6 inches. Candy Mountain is 5.1 inches. Lewis-Clark is 12.7 inches.
Evapotranspiration
Evapotranspiration (ET) is a measurement of the amount of soil water lost to the atmosphere via evaporation from the ground surface and from the plant leaves. The latter process is also called transpiration.
There are several ways to calculate and present ET. It is important to understand their distinction if you are using ET to determine irrigation needs. See our webpage on Irrigation for more information on irrigating wine grapes in Washington.
Evapotranspiration Values
- Epan: A measured value of how much water was evaporated from an open pan of water on a given day
- ETo: A calcuated value using the Penman-Monteith equation and approximates an ‘open’ pan or grass.
- ETr: Also a calculated value that references alfalfa water use. ETr is typically 20% greater than ETo as alfalfa uses more water than grass.
- ETc: A calculated, crop-specific value (crop evapotranspiration). ETc is calculated by multiplying ETo by a crop-specific coefficient (Kc).
ETc = ETo*Kc- In cases where a crop demands a lot of water relative to grass, Kc will be greater than 1, if crop is more water efficient than grass, Kc will be less than 1.
- Wine grapes are a fairly efficient plant in terms of water use, and their Kc is typically less than 0.8; but water needs change throughout the season.
- Kc increases from 0 (budbreak) to 0.8 (fully developed canopy) and then remains constant until the leaves fall off. Kc for juice grapes changes from 0 to 1.1.
Long term average ETc – Yakima Valley AVA
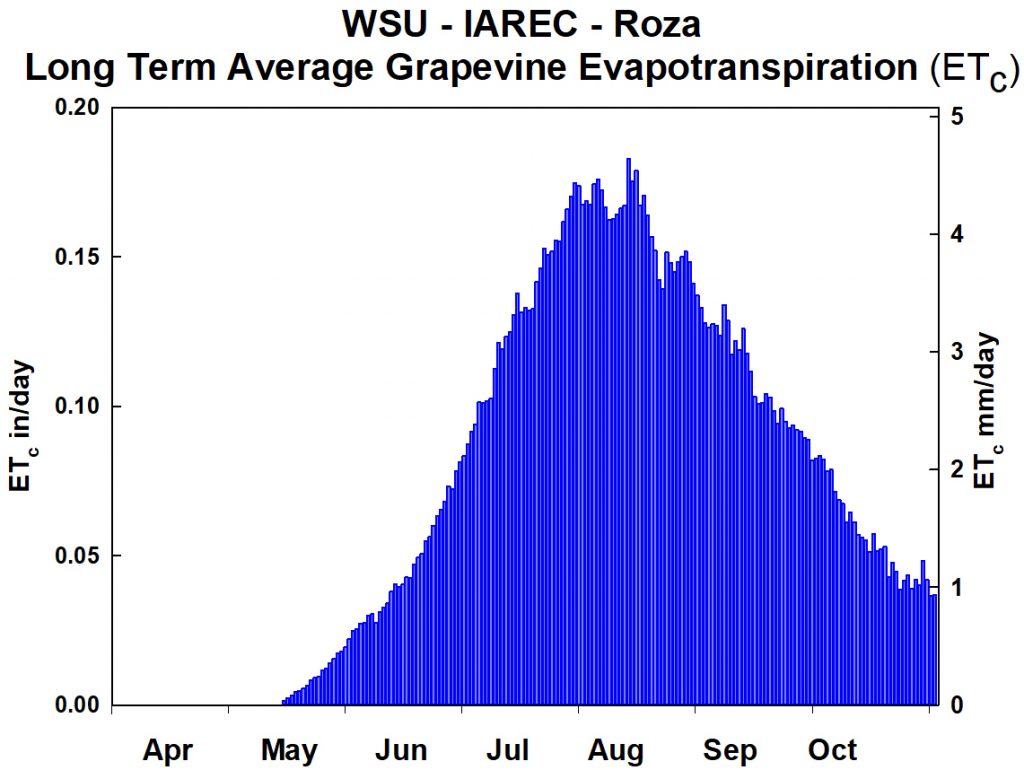
The long-term crop-adjusted evapotranspiration (ETc) for grapevines, based on weather from the WSU AgWeatherNet ‘Roza’ Weather Station. ETc is presented as acre-inches per day, and displayed from 1 April to 31 October. There is little ETc in April, with ETc beginning in May. ETc peaks in July through September, generally around 0.15 inches (or 4.5 millimeters). ETc slowly declines in September through October. ETc is not measured after October, as there is very little water lost once the vine no longer has a canopy.
Weather and Climate Information
AgWeatherNet
Washington State University is very fortunate to have one of the best weather networks in the country. AgWeatherNet (AWN) provides access to local weather stations from throughout Washington, in addition to providing access to some disease and pest models. Send alerts to your email or phone, or download raw data straight to your computer.
Weather and Climate Maps and Forecasts
- National Weather Service (NOAA) – Forecast Maps
- Climate Prediction Center (NOAA) – Forecast Maps
- El Nino / La Nina Maps (NOAA)
- US Drought Information (NOAA)
AgWeatherNet Stations Representing WA American Viticultural Areas (AVAs)
These weather stations are used to present the AVA cumulative growing degree days (GDD; base 50F), and season-long precipitation. “Long-term” data presented on the wine.wsu.edu “Weather” page is from the last 15 years, with the exception of the Candy Mountain AVA data (Red.Mtn.S AgWeatherNet station), as that station was installed in 2016. Additional weather for each station can be downloaded here.
| AVA | AgWeatherNet Station Name |
|---|---|
| Ancient Lakes | George |
| Candy Mountain | Red.Mtn.S |
| Columbia Gorge | Maryhill |
| Horse Heaven Hills | Paterson |
| Lake Chelan | Chelan |
| Lewis-Clark Valley | Anatone |
| Naches Heights | Naches |
| Puget Sound | Mount Vernon |
| Rattlesnake Hills | Outlook |
| Red Mountain | Benton City.E |
| Rocks | College Place |
| Royal Slope | Royal Slope |
| Snipes Mountain | Sunnyside.N |
| Wahluke Slope | Mattawa |
| Walla Walla Valley | Tracy.W |
| Yakima Valley | Roza.2 |