VEEN is curated by WSU Viticulture Extension. For questions on articles, or to request to submit an article in future issues, reach out to Michelle Moyer.
This issue of VEEN was originally published as a .PDF in April 2011, and posted online. Some content here will differ from that original issue. The issue is archived, but accessible on the VEEN Archive webpage.
A Note from the Editors
Washington State University’s Viticulture and Enology Extension News (VEEN) is back! With a slightly new look and different publication frequency (twice a year, Spring and Fall), we hope this will be a useful resource and guide to the information available to you through WSU.
This issue focuses on viticulture, with articles ranging from cold damage assessment, new and emerging vineyard pests, graduate student research in clonal identification, irrigation sensors for vineyards, and more. There is also an article on dealing with high acid wines.
Don’t forget: more information is just a click away at: www.wine.wsu.edu, including event information, Extension Publications, and Articles regarding current issues in V&E.
Of course, we always welcome suggestions, comments and questions as we work to help build on the extension and outreach resources available from the V&E Program at WSU. Happy reading!
Dr. Michelle Moyer
Viticulture Specialist
Dr. Jim Harbertson
Enology Specialist
Table of Contents
Connect With Us
V&E Certificate Program
WSU Grape Cold Hardiness Program
By Markus Keller, WSU Prosser
The ‘Thanksgiving freeze’ on November 24, 2010, caused damage to buds and vines that varied widely among varieties and vineyard locations. Despite a general warming trend in winters seen in the last 30 years, this freeze event demonstrated once again that cold injury remains a major concern for Washington’s wine and juice grape industries.
The viticulture team at WSU continues to provide critical temperatures for cold hardiness at our WSU Grapevine Cold Hardiness Monitoring website. This service began over 20 years ago and is conducted primarily as a service to Washington’s grape growers in collaboration with Ste. Michelle Wine Estates, Thurston Wolfe Winery, and Hogue Ranches. Our work is sponsored by WSU, the Washington Association of Wine Grape Growers, and the Washington State Concord Grape Research Council.
The program regularly tests the cold tolerance of buds and canes [1] and posts these results weekly on the website. By clicking on a variety name located in the center cold-hardiness table (about 20 varieties are available), you can access a seasonal cold hardiness graph specific to that variety, along with the seasonal temperature pattern. Growers may use these graphs (Fig. 1) to follow seasonal trends and forecast approximate hardiness levels based on current temperatures.
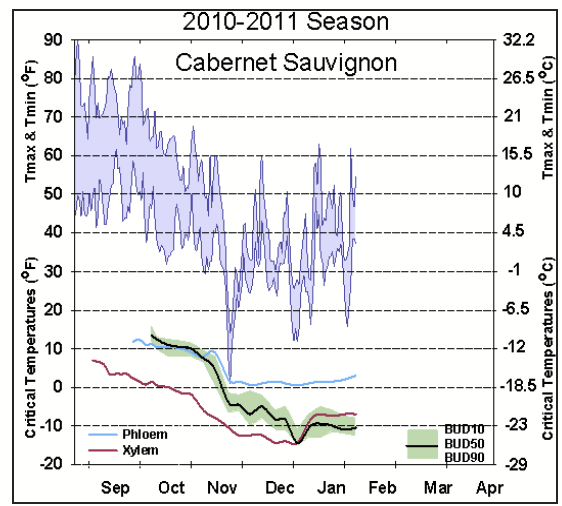
This information is important, since the temperatures at which the buds, bark (phloem), and wood (xylem) are killed fluctuate throughout the winter. Using this information is crucial for growers to make informed decisions concerning freeze protection, as well as post-freeze sampling and pruning strategies [2-5].
Due to equipment and labor limitations, the WSU team cannot test every variety, every week, at every location. Fortunately, thanks to a grant from the USDA Viticulture Consortium-West, we are currently developing a mathematical model [6] that will eventually be able to fill in the gaps.
This model will run on AgWeatherNet (AWN). AWN is a large network of more than 130 weather monitoring stations distributed throughout the state, and is hosted and supported by WSU for the benefit of Washington State’s various agricultural industries.
For further reading on cold hardiness, see the following:
- Mills L.J., Ferguson, J.C., and Keller, M. 2006. Cold hardiness evaluation of grapevine buds and cane tissues. AJEV 57:194-200.
- Davenport, J.R., Keller, M. and Mills, L.J. 2008. How cold can you go? Frost and winter protection for grape. HortScience 43:1966-1969.
- Keller, M. 2010: The Science of Grapevines – Anatomy and Physiology. Elsevier: Academic Press, Burlington, MA.
- Keller, M. and Mills, L.J. 2007. Effect of pruning on recovery and productivity of cold-injured Merlot grapevines. AJEV 58:351-357.
- Wolfe, W. 2000. Vine and vineyard management following low temperature injury. Proceedings of the ASEV 50th Anniversary Annual Meeting, Seattle, Washington, June 19-23, 2000. pp. 101-110.
- Ferguson, J.C., Tarara, J.M., Mills, L.J., Grove, G.G., and Keller, M. 2011. Dynamic thermal time model of cold hardiness for dormant grapevine buds. Annals of Botany 107:389-396.
Cold Damage in Vineyards
By Michelle Moyer, WSU Prosser
Spring is quickly approaching, making it easy to forget the long, cold winter. For many grape growers across the state, however, the evidence of just how cold it really was has become painfully obvious. The ‘Thanksgiving Freeze’ of 2010 not only announced the early arrival of winter, it led to damage in grapevine buds, canes, and trunks; damage which we may have not yet fully realized.
On October 31, 2002, a similar cold snap led to substantial vine inner bark (phloem) damage. As a result, WSU was frequently asked the question of “what to do next?” The resulting work demonstrated that if there was substantial phloem damage, but relatively little bud damage (67% versus 25%, respectively), vines could fully recover [1]. This occurred regardless of pruning severity (ranging from minimal pruning to complete bud removal). However, minimal pruning may help in yield compensation. It is also important to consider overall vine health and development in the years following damage, i.e. recovery years are not the best time to implement severe stress practices.
What do you do if you have substantial bud damage in addition to phloem damage? The first thing to consider is where that bud damage is seen. If injury is closer to the cordon (i.e. nodes 1-5), but bud further out are alive, then it is advisable to hedge. If the damage is only seen on distal buds, then normal spur or cane pruning is acceptable [2]. The challenge, however, is determining what to do in those situations where you are faced with 75-100% damage, at all nodes. Generally, a “wait and see” approach is suggested: hedge, then wait until budbreak to assess damage. Shoot numbers can then be adjusted or the decision to retrain can be made.
So how do you know the extent of cold damage in your vineyard? Sample! More information on sampling techniques can be found at the WSU Grapevine Cold Hardiness Monitoring website. When sampling, select individual vines randomly, but cover areas that are representative of sectional differences in your block, including those in areas that are prone to cold/frost damage. This will provide information on whether particular sections of your vineyard sustained more damage than others.
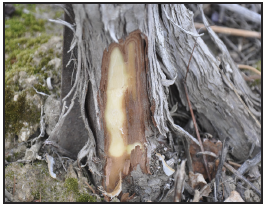
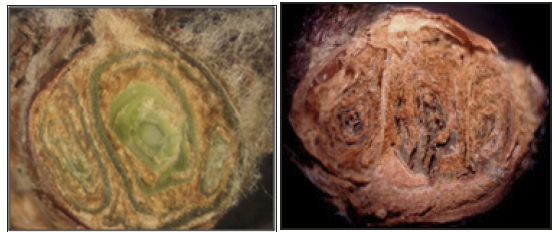
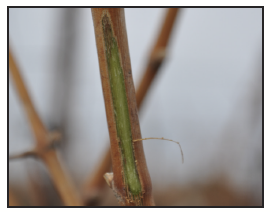
After collecting canes from these selected vines, the assessment process can begin. Specifics on assessment can be downloaded from our website. We determine the viability of tissues by their color [3]: green is good, healthy tissue; brown is dead tissue. There can also be an array of damage (and therefore, colors), so it is good to have reference tissue. In trunk wood (xylem), milky-white to light brown is also an indication of damage (Fig. 1).
For buds (Fig. 2), record the location on the cane where you see damage, as mentioned above. The same is true for cane sampling (Fig 3). To assess trunks look at both slightly above the soil line, and near the head. Pay particular attention to the south side of the vine, as it can be prone to cold damage due to daytime deacclimation as a result of reflected heat from the snow. Trunk sample with caution: DO NOT GIRDLE. Sampling for cold damage should be done shortly before pruning, to reduce the likelihood that additional damage will not go unnoticed.
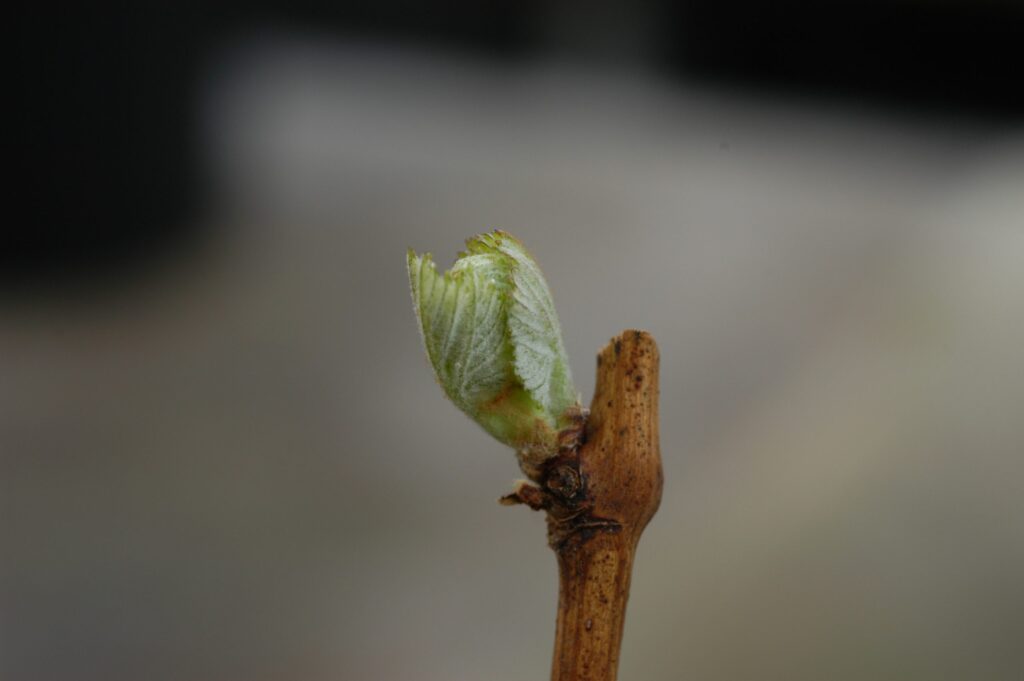
What can we learn from all of this? In order to deal and adjust for cold damage, you need to know the extent of it. Assessing damage by looking at buds, canes and trunks before pruning is critical. While we are seeing damage as a result of the ‘Thanksgiving Freeze’ of 2010, there are some pruning tricks that can be done to either ensure plant survival, a crop, or both.
References
- Keller, M, and Mills, L.J. 2007. Effect of Pruning on Recovery and productivity of Cold-Injured Merlot Grapevines. AJEV 58:351-357.
- [2] Wolfe, W. 2000. Vine and Vineyard Management Following Low Temperature Injury. Proc. Of the ASEV 50th Anniversary Annual Meeting. Seattle, WA. June 19-23, 2000.
- Mills, L., J. Ferguson, and M. Keller. 2006. Cold-hardiness evaluation of grapevine buds and cane tissues. Am. J. Enol. Vitic. 57:194-200.
Pest Alerts for 2011
Spotted Wing Drosophila (SWD)
a new pest in Washington orchards and vineyards. First introduced to the continental USA in 2008, it has slowly made its way north from California to most growing regions in Washington. Related to other vinegar flies, SWD is a cause for concern due to the female’s ability to pierce the skin of, and lay eggs in, ripening fruit as opposed to over-ripened and decaying fruit.
While preliminary studies at WSU indicate that grapes may not be a preferred fruit source for SWD, it is a suitable food choice, and the fly is still capable of causing damage to grapes. In addition to the direct physical damage cause by egg-laying, the piercing activity of the fly can also lead to the introduction of bacteria, yeasts and other fungi which can lead to rot or a reduction in wine quality.
Monitoring your vineyard for the presence of SWD before starting a spray program is advised. This can be done using apple-cider vinegar traps. Information on how to build traps is available at: http://extension.wsu.edu/swd.
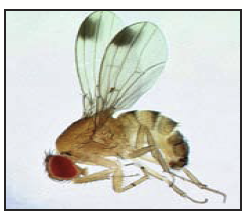
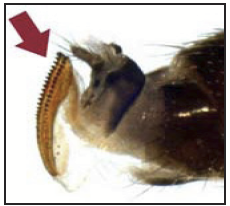
Properly identifying SWD is critical to control, as there are many types of native fruit flies that can resemble SWD. Flies will be less than 1/8” in size, and will have red eyes. Male fruit flies are identified by the presence of a black spot near the tips of their wings (Fig.1), and they have 2 sex combs. Female flies are harder to ID, as they do not have the characteristic wing spots. However, they do have a prominent ovipositor that is saw-like and used to pierce fruit skin (Fig. 2) in order to lay eggs in ripening fruit.
Brown Marmorated Stink Bug (BMSB)
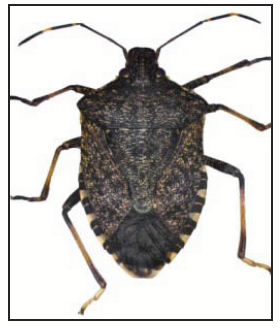
The Brown Marmorated Stink Bug (BMSB) was first found in the Allentown, PA area in the 1990s. Since then, it has established itself as both a residential and agricultural pest. In addition to congregating in houses, it feeds on a number of crops, causing a range of damage and disfigurement of fruit and vegetables, including but not limited to, tree fruit, grapes, berries, vegetables, corn, soybeans, and ornamental plants.
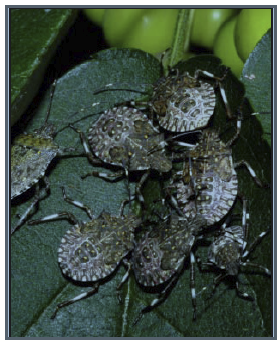
It is distinguished from other Stink Bugs by its stripped antennae, black and white banding on the abdomen, and smooth shoulders.
The challenge with BMSB is that it travels quickly, usually as a result of hitchhiking on vehicles and storage units. It has been collected in Vancouver, WA, but has not been found in eastern WA. If you suspect you have BMSB, notify your local WSU Extension agent. Capture a bug for identification, and keep it in your freezer until you can take it in for examination.
Botrytis Bunch Rot and Powdery Mildew: 2010 Review
By Michelle Moyer and Gary Grove, WSU Prosser
Climate is what we expect, weather is what we get.
Mark Twain
Uncharacteristic cool and wet weather in 2010 resulted in many challenges, from delayed ripening to high juice acidity. A very noticeable challenge was the widespread occurrence of Botrytis Bunch Rot (BBR), and the economic consequences of this epidemic are not entirely clear. Preliminary information from WA indicates that the disease affected about 8,000 and 3,000 acres of white and red grape varieties, respectively. While most affected vineyards had some healthy clusters, this would equate to losses of $25,056,000 and $15,132,000, respectively. (Assumptions based on 4 ton/acre crop loads for ‘Chardonnay’ and ‘Cabernet Sauvignon, using prices listed in the January 2007 USDA-NASS Grape Release). To prevent the harvest of diseased bunches, hand-harvest was used in some vineyards that are normally machine-harvested, at an estimated additional cost of $375 per ton (‘Chardonnay’).
Climates such as those in western WA are prone to annual outbreaks of BBR due to the favorable moist, cool conditions, particularly near bloom. Due to eastern WA’s normally arid summer climate, BBR occurence tends to be sporadic. However, the unseasonably moist weather between the months of May and June, then again in September of 2010, set the year up for the wide-spread outbreak.
BBR can infect fruit at two different stages: from bloom to bunch closure, and again during véraison to harvest. During the first stage, BBR infects clusters through the cap scars and dying stamens, and can also survive on floral and other debris that gets stuck inside the cluster during closure. These infections remain latent (inactive) until véraison, where they can then express the classic BBR symptoms.
At the end of the season, BBR can infect ripening fruit through wounds, often caused by insect feeding, powdery mildew damage, or berry splitting as a result of compact cluster architecture. BBR infects fruit in this manner because it is a relatively weak fungal pathogen. It prefers readily accessible or weakened food sources. A major issue in 2010 was the need for increased hang time to bring fruit to desired sugar and acid levels. Longer hang-time means more chances for infection and BBR development.
If we have our normal summer weather pattern in 2011, there is the possibility of over-spraying for BBR as a compensation for last year. To avoid this, WSU in collaboration with WAWGG, held a workshop in January to help develop a rational strategy for managing BBR in 2011. Drs. Doug Gubler (UC-Davis) and Wayne Wilcox (Cornell University) shared their extensive experiences with BBR management in California and New York, respectively. Washington growers recognize the bloom to pea-sized berry period as the keystone for managing powdery mildew (PM) on fruit, and typically make 2-3 PM fungicide applications during this period to control it. Like PM, the bloom period is critical for BBR control. The use of fungicides that offer control of both is recommended at the highest labeled rates during bloom to control PM and to prevent BBR infection of flower parts.
Gubler and Wilcox also recommended taking notes on prevailing and predicted weather conditions when devising BBR management strategies. If the 2011 season has above-average precipitation, additional dual-purpose fungicide applications should be considered at pre-bunch closure, while BBR specific compounds should be applied at véraison and preharvest (Table 1). In eastern WA, years with “normal” precipitation (e.g. DRY between fruit set and harvest), late season BBR fungicide sprays may be unnecessary.
| Timing | Compound | Powdery Mildew Control | Botrytis Bunch Rot Control | Notes |
|---|---|---|---|---|
| Bloom to Fruit Set | Trifloxystrobin (Flint) | Yes | Yes | Apply at highest labeled rates for dual control. |
| Bloom to Fruit Set | Pyracostrobin + boscalid (Pristine) | Yes | Yes | Apply at highest labeled rates for dual control. |
| Bloom to Fruit Set | Difenconazole + cyprodinil (Inspire Super) | Yes | Yes | Read label for appropriate rates. |
| Bunch Closure | Trifloxystrobin (Flint) | Yes | Yes | Apply at highest labeled rates for dual control if wet weather conditions. |
| Bunch Closure | Pyracostrobin + boscalid (Pristine) | Yes | Yes | Apply at highest labeled rates for dual control if wet weather conditions. |
| Bunch Closure | Difenconazole + cyprodinil (Inspire Super) | Yes | Yes | Read label for appropriate rates. |
| Véraison to Harvest | Elevate (fenhexamid) | No | Yes | |
| Véraison to Harvest | Scala (pyramethanail) | No | Yes | |
| Véraison to Harvest | Rovral (iprodione) | No | Yes | |
| Véraison to Harvest | Vangard (cyprodinal) | No | Yes |
The role of leaf removal in managing PM and BBR cannot be overemphasized. Both Gubler and Wilcox stressed the incorporation of this cultural practice into the overall vineyard disease management system. Gubler presented data indicating that leaf removal is equally or more important than fungicide applications for managing BBR. Leaf removal also improved management of PM. Much of this is through better spray penetration into the fruit-zone, and increased air circulation and sunlight penetration, which reduces the environmental favorability for BBR and PM fruit infection.
Last year also presented challenges in controlling PM, though not to the same extent as BBR. As mentioned, targeting PM fungicides from bloom to pea-size is the key to controlling disease development on fruit. What many people don’t realize is that control of PM is also a key component of controlling BBR. Severe PM infections can result in fruit cracking, a clear entryway for BBR. However, light PM infections (“diffuse infections”), on fruit can enhance BBR. Diffuse infections cause microscopic damage to the berry skin. These are also direct avenues for BBR infection.
Last year highlighted the role of weather in disease development. Knowing this influence is important in determining the timing and type of fungicide application. In 2011, keep that in mind, and be prepared to adjust if conditions change.
Use pesticides with care. Apply them only to plants, animals, or sites listed on the labels. When mixing and applying pesticides, follow all label precautions to protect yourself and others around you. It is a violation of the law to disregard label directions. If pesticides are spilled on skin or clothing, remove clothing and wash skin thoroughly. Store pesticides in their original containers and keep them out of the reach of children, pets, and livestock.
The Value of Clonal Variation in Washington Grapes
By Kathie Nicholson, Graduate Student, WSU Pullman
Compared to other fruit crops, there is very little focus on developing new wine grape varieties, uutside of breeding for disease resistance, shorter ripening time, drought resistance, or other similar characteristics. The existence of grapevine clones, i.e. the specific selection of grape varieties with desirable characteristics compared to the standard, such as looser clusters or increased cold hardiness (Fig. 1), provides viticulturists with plant material choices which may be better suited to a particular region or may exhibit fruit qualities that better fit the winemaking styles of the area.
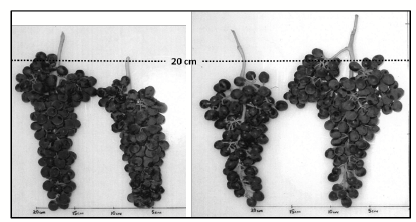
(Image from: W. Farquhar 2006. http://ucanr.org/sites/ intvit/files/24458.pdf.)
Clones result from genetic mutations that can occur during vine development, and this variation is then maintained with vegetative propagation. In addition to looser clusters or cold hardiness, changes in chemical components of the fruit may occur that can influence wine characteristics, such as fruit aroma, wine texture, and aging ability. However, these clonal differences are not visible, making traditional plant identification using ampelography difficult. Currently, clonal verification is based on the faith that the vine used for propagation was correctly identified.
Is there a need for a resource that could genetically confirm clonal identity within wine grape varieties? Additionally, how important are clonal variations to the Washington wine industry, and to what extent are consumers interested in this facet of the wine they purchase?
These questions arose as a research project that began here at WSU looking at various methods to identify genetic differences among wine grape clones. We felt it was important to know the viewpoints of the population that could benefit from this research, thus, two surveys were conducted. The first was directed to the wine industry to determine their perceived value of clones, and the extent they believe consumers would be influenced by identifying clones on a wine label.
The second survey was directed to consumers regarding their general knowledge and interest in wine grape clones, and the extent their purchases would be influenced if labels included clonal information. Both surveys asked if the wine industry in Washington State would benefit from a resource that could genetically confirm clonal identity.
From the wine industry, 72 responses were received (21%). When buying vineyard stock, 88% of wine industry respondents believed clonal varieties were an important consideration; 47% responded that it is an important consideration when purchasing grapes for the winery. When it came to what they felt would be important to consumers, only 26% of the wine industry respondents felt that having confirmed identity of grape variety clones would be important to the consumer and consequently enhance sales, and 33.3% responded that it would not be important to the consumer.
The consumer survey was a random sampling from consumers at a Pullman, WA, wine shop, and requests for participation were posted on two WSU websites related to viticulture and enology, resulting in 52 responses. Although 56% of consumers polled were not previously aware of clonal variation, after a brief description, 81% indicated that their purchase would likely be influenced by identification of the clone on the label (assuming they knew the characteristics of that clone), and 71.2% indicated they would possibly pay more for a bottle if they knew the clone used exhibited desired characteristics. Both the wine industry and consumers indicated that there is a need for a resource that could genetically confirm clonal identity, with positive responses of 79% in both cases.
In summary, the survey results indicated that clonal variation is important to the wine industry, is potentially important to consumers, and that there is a need for a resource in Washington that could genetically confirm clonal identity. Additionally, results indicated that consumers are possibly more interested in clonal variation than the industry believes they are. Realization of this consumer interest could provide motivation for novel marketing strategies in the Washington wine industry.
Beneficial Insect Conservation in Washington Vineyards
By David James, WSU Prosser
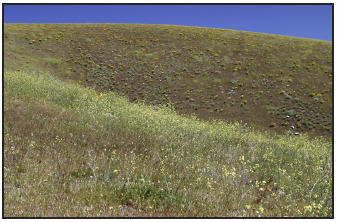
The concept of ‘Farmscaping’ Washington vineyards by restoring native shrub-steppe plants and habitats has been mooted for a few years now. Research on the feasibility and potential of ‘beauty with benefits’, a program that envisioned developing habitat for predators and parasitoids of grape pests, has commenced at WSU-Prosser with funding from the Western Sustainable Agriculture Research and Education (WSARE), the Northwest Center for Small Fruits Research (NCSFR) and the WA Wine Advisory Committee.
Initial studies looked at the potential of xeric, flowering native perennial plants for attracting natural enemies of grape pests. In 2010, 43 species of flowering perennials in Yakima Valley were evaluated for beneficial insect attraction. Attraction of 9 groups (families, genera) of beneficial insects was assessed using yellow sticky cards placed on, or adjacent to, plants. The top 10 species for attraction of beneficial insects were Showy Milkweed, Yellow Sweetclover, Wood’s Rose, Western Clematis, Gray Rabbitbrush, Yarrow, Green Rabbitbrush, Ocean Spray, Hoary Aster, and Lewis’ Mock Orange.
Different plants attracted different beneficials. For example, mite-eating ladybeetles were strongly attracted to Rock Buckwheat and Columbia Basin Prickly Pear, while minute pirate bugs were most attracted to Yellow Sweetclover, Gray Rabbitbrush, Tall Buckwheat and Showy Milkweed. Predatory thrips were most common on Oregon Sunshine and Yellow Sweetclover while ladybeetles and parasitic wasps were favored by Lewis’ Mock Orange and Clematis.
Fineleaf Hymenopappus, Golden Currant, Showy Milkweed, Coyote Mint and Wood’s Rose attracted ichneumonid and braconid wasps while Munro’s Globemallow attracted Anagrus wasps. Gray Rabbitbrush attracted almost twice as many parasitic wasps from other families than any other plant. At least 23 plants emerged as having potential for attracting beneficial insects; all are native except one (Yellow Sweetclover).
These data are preliminary and will be expanded in 2011. Plants like the buckwheats, Yarrow and Yellow Sweetclover appear to be well-suited as sustainable, IPM-enhancing ground covers because of their hardiness, drought tolerance and likely mowing tolerance.
We will shortly establish a website dedicated to our vineyard habitat restoration project. This site will provide practical information on how to optimally restore native habitats in your vineyard to provide the greatest benefits to pest management and conservation of native plants, bees and butterflies.
Irrigation Sensors for Washington Vineyards
By Troy Peters, WSU Prosser
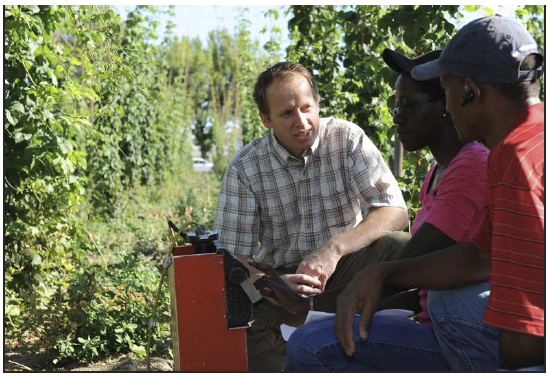
Good irrigation water management will increase yields, improve crop quality, conserve water, save energy, decrease fertilizer requirements, and reduce non-point source pollution. Using soil moisture measurements is one of the best and simplest ways to get feedback to help make water management decisions. However, the installation, calibration, and interpretation of the data from these instruments is often overwhelming. Here’s an attempt to provide practical recommendations for using these sensors to improve your operation.
Soil Water Content-based Soil Moisture Sensors: (Capacitance, Neutron Probe, Gravimetric)
Soil water content measurements are more meaningful for irrigation scheduling when they are compared to the maximum amount of water that the soil can hold long term (field capacity). The simplest way to determine your soil’s field capacity is to use the sensor to take a soil water content measurement at a time when you are confident that the soil is full of water, yet free water has had time to drain. Good times to make these measurements are in the spring as soon as soil thaws (assuming adequate soil moisture recharge over the winter), or 12 to 24 hours after a heavy irrigation. The water content measurement must be multiplied by the depth of soil in the root zone that it represents, to give the total water content in that soil depth.
It also helps to have an estimate of the soil water content at which the plants begin to experience water stress. This can be estimated from the previously measured field capacity and the soil’s available water capacity (AWC). See http://websoilsurvey.nrcs.usda.gov for soil survey information on your soil’s AWC. This AWC number is then multiplied by 42 inches (3.5 ft) root depth for most vines, to get the inches of water that is held between field capacity and wilting point. It may be necessary to use a different root depth if the soil is shallow.
To manage vines for no stress, it is a good idea to limit the soil water depletion to only 50% of the AWC in the root zone. For example the soil AWC from websoilsurvey is 0.20 cm/cm (same as in/in). Multiply this by 42 inches to get a total AWC in the root zone of 8.4 inches. To manage for no stress the maximum depletion should be half of that, or 4.2 inches. If the field capacity, measured early in the spring (Mar. 1), is 10.5 inches in the root zone, then irrigate before the soil water content reaches 6.3 inches (10.5 – 4.2) if manageing for no stress. To impose water stress, then irrigate to keep soil water content above 2.1 (10-8.4), but below 6.3 inches. Wilting point is at 2.1 inches.
Use plant and soil observations over time to refine these estimates. For example if the first observable signs of plant water stress is at 7.0 inches instead of 6.3, then the 6.3 inch estimate of the water stress line should be re-set to 7.0. With this method, the absolute accuracy of the sensor is less important, because it is just being compared to itself.
Tension-based Sensors: (Watermark Sensors, Tensiometers)
When using tension-based soil moisture sensors, the soil’s field capacity, wilting point, and the maximum depletion point are mostly irrelevant. A soil that is full of water will have a measured soil water tension near zero. For maximum growth, vines should be irrigated before the soil tension reaches 40-50 centibars (Note: centibar is a unit for tension. The higher the number, the greater the water stress). For regulated deficit irrigation (RDI), this could be increased to 80 centibars. Again, since these measurements can be inaccurate and soil specific, refine your limits using crop observations over time. For example, note the measured soil water tension at the earliest indications of water stress (this will appear first in sandy, or shallow soil areas), and irrigate before this point in the future. Also, take readings right after an irrigation; if the bottom sensor goes to zero, then it’s possible you over-irrigated. If it shows no movement, apply more water next time. A word of caution when using tension-based soil moisture sensors when the soil is dry: Many growers find their use frustrating as the sensors tend to lose suction, or contact, with the soil under this condition.
Additional Recommendations:
- Avoid preferential flow of water from the surface to the sensor due to installation process.
- Flag the sensor so it can be easily found.
- Graphical representation of the data greatly helps with data interpretation.
- Use soil water measurements with irrigation scheduling tools such as Kansched and daily water use data from AgWeatherNet or AgriMet for better water management.
- Keep records. Correlate readings with observations.
- Stay away from both the field capacity, and water stress points if possible.
- Realize that soil and sensors have variability.
- Be patient and stick with it. It may take a year or two before you are good at interpreting your sensor readings.
AgWeatherNet Update
By Gerrit Hoogenboom, WSU Prosser
Network (AgWeatherNet, AWN) is one of the largest automated agricultural weather station networks in the USA. Formerly known as PAWS, AWN was upgraded in 2008 to state-of-the-art data logging equipment and weather monitoring sensors, along with a new communication system using cell data telemetry.
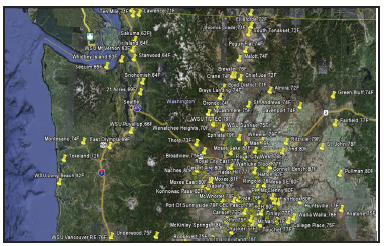
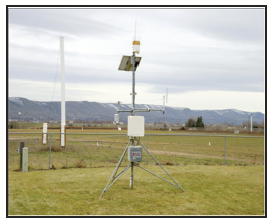
AWN currently encompasses 135 stations with many stations located in the Columbia Basin as shown on the welcome screen of the AWN website (Fig. 1). Each station monitors air temperature, relative humidity, rainfall, solar radiation, wind speed and wind direction, leaf wetness and soil temperature (Fig. 2). The observations are taken at a 5-second frequency and summarized every 15 minutes. AWN has two data computer servers, one at the Washington Tree Fruit Research Center in Wenatchee and one at the Irrigated Agriculture Research and Extension Center (IAREC) in Prosser. Both computers communicate with each weather station through the internet and the cell data telemetry system.
Users of AWN can access all weather data and related information from the website. Access is free; however, you have to create a login name and password. The “Current Observations” option provides the current air temperature, dewpoint temperature, wind speed and other information for all stations. This information is updated every 15 minutes.
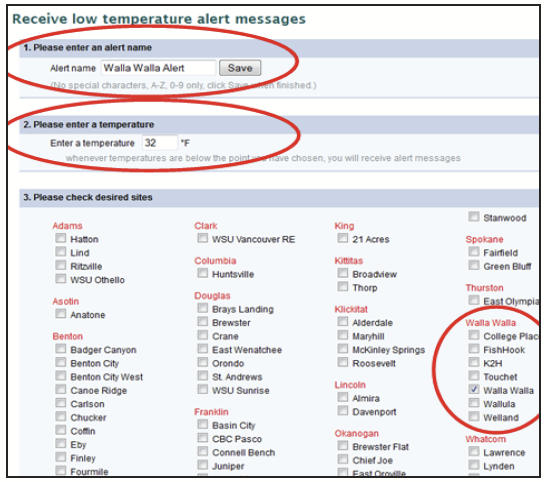
If you are interested in receiving a warning when the temperature has dropped below a critical threshold value, such as for frost and freeze protection, you can set up an alert message under “Ad Low Temperature Alert” (Fig. 3). After you have defined your alert, a text message will be sent to your mobile or regular e-mail address when this temperature has been reached. You can delete your alert under “Run Favorites/Alerts.”
Another temperature feature of interest, especially during winter, is the Grape Cold Damage Decision Aid that can be accessed from the “Grape Cold Damage” option. The critical temperatures on this webpage are provided by WSU’s Viticulture team. The output tells you when a critical temperature that results in tissue death has occurred. The categories of BUD10, BUD50 and BUD90 correspond to the temperatures at which 10%, 50% and 90% of the primary buds will be killed. PHL10 refer to the temperature at which 10% of the phloem is damaged or when cane damage starts, and XYL10 refers the the temperature when phloem damage is complete and xylem damage starts. Please feel free to explore the AgWeatherNet website. In future issues of VEEN, we will discuss other features of the AgWeatherNet website, and how to use additional alerts to aid in production decisions.
Dealing with High Acidity in Must and Wine
By Thomas Henick-Kling, WSU TriCities, and Jim Harbertson, WSU Prosser
The following is a compilation of mini-articles released by Enology Extension during the 2010 harvest season. The scope of the articles revolved around management of must and wine in challenging production years, such as that seen in 2010.
Monitor pH and Titratable Acidity
Mistakes with acidity can be made in cool years. High titratable acidity is more acceptable in white wines but it is disrupting in red wines. Excessive acidity can cause wine imbalance, and accentuate astringency in red wines. There are several factors, including acidity, that affect astringency (tannin concentration, alcohol concentration). To make a balanced wine, you must keep these in mind. As a guideline, try to have must titratable acidity (TA) for red wines near 6 g/L. In some cases, such as Pinot noir, a TA of 7 g/L might be acceptable. Finished wine pH can be between 3.3 and 3.8, depending on the tannin content. Low tannin wines typically have lower pH. If the must TA is higher than the goal of 7 g/L then you should consider deacidification.
Acid adjustments in wine can be made up until bottling. In addition, you can warm wine before bottling to improve mouthfeel and reduce vegetative flavors. This can be done by heating wine to 104°F for ~2 days.
Bench trials are generally a best-practice for wine adjustments. Bench-trials allow you to see if the adjustments have the desired effects before these adjustments are made on a larger scale.
Deacidification
Potassium or calcium carbonate (K2CO3, CaCO3) can be used to remove wine acids. Pre-fermentation addition is done for two reasons. First, with pre-fermentation addition, there is less danger of losing aroma compounds that are primarily in non-volatile precursor forms. These precursors are less susceptible to loss due to this type of addition. Second, wine yeast and lactic acid bacteria are sensitive to high acidity and low pH. Wine yeast can tolerate pH values below 3, but are stressed. Fermentation of very low pH musts should be done at moderate temperatures around 68°F.
Biological Deacidification – Malolactic Fermentation
Malolactic fermentation (MLF) is an excellent tool to lower wine acidity, improve mouthfeel, and remove some unripe, green flavor characteristics. It is used in (almost) all red wines and it works well in most white wines, especially Chardonnay, Sauvignon Blanc, and Pinot Gris. It also can be used in Riesling. Blending of MLF and non-MLF wine should also be considered (note: sterile filter the blended wine to avoid unwanted MLF in the bottle!). In order to avoid buttery ML odors, it is best to use a co-inoculation of yeast and ML bacteria. Alternatively, inoculate wine at the end of alcoholic fermentation and keep the wine on yeast lees. The yeast will remove excess diacetyl and other ML flavors and help enhance fruity flavors in the wine. Alternatively, a yeast fining can be done after completion of MLF, to remove excess buttery flavors.
A large number of ML starter cultures are available for direct inoculation. However, all lactic acid bacteria are strongly inhibited at pH values below 3.2. The ideal starting pH for MLF is between 3.2 and 3.4, in the presence of some alcohol (5% and more). In this condition, Oenococcus oeni will dominate all other lactic acid bacteria. Special adaptation procedures will have to be used to induce MLF in wines below a pH of 3.1.
For low pH wine, deacidify a small amount to raise the pH to about 3.4, inoculate it with a starter culture, and after ~2/3 of the malic acid has been metabolized, use it to inoculate another part of wine which can be of lower pH. When inoculating wine with a wine ML starter culture, the starter culture must be 10% by volume. Another possibility is to start with a wine/water/juice ML starter culture. If you use a liquid starter culture, check it under the microscope to be sure it is Oenococcus and does not contain spoilage yeast or unwanted bacteria.
Yeast and bacteria compete for many of the same nutrients. Special nutrient mixes for ML bacteria also can be helpful when inducing MLF soon after completion of alcoholic fermentation. Many of these nutrients are depleted during alcoholic fermentation. The autolyzing yeast relase some nutrients back into the wine.
Deacidification with K2CO3, CaCO3
Potassium (K) and calcium (Ca) will react with the grape acids (malic and tartaric) to form insoluble salts, and carbon dioxide will be given off as a result. As a natural occurence in winemaking, K will form several types of salts with tartartic acid and malic acid (K2TA, KHTA, K2MA, KHMA). Calcium, as a contrast, will only form a couple of salts (CaTA, CaMA). However, Ca can form a salt with malic and tartaric acid simultaneously (MAHCaHTA) and the treatment has been dubbed the “double-salt” technique as a result. The formation of the double-salt is actually rare, but the name persists.
Which Carbonate Salt Should I Use?
If the TA needs to be lowered by only 2-3 g/L, simply use potassium bicarbonate or potassium carbonate (KHCO3 or K2CO3). If more acid needs to be removed, it is better to use the double-salt deacidification with calcium carbonate (CaCO3). It is important to note that the double-salt technique favors the removal of tartaric acid rather than malic acid, unless the initial concentrations of malic acid are double the concentration of tartaric acid. This technique should only be carried out on a portion of the juice (~25%) because it would otherwise destabilize the wine by leaving primarily malic acid behind, which is easily metabolized by yeast and bacteria. Only add the amount of calcium carbonate for the entire lot to a small portion of the juice. Because such a large concentration of CaCO3 is used, the treated juice can reach a pH between 4.5-6.5. You will need to add the treated juice back to the original lot, and then re-adjust the juice using tartaric acid to your targeted pH.
During CaCO3 addition, juice is agitated to help the precipitation process. The reaction time is short: only 30 min in a large tank. Settling takes ~60 minutes.
When doing the CaCO3 addition, it is counter productive to chill the juice. Calcium-tartrate solubility is unaffected by cold temperatures and carbon dioxide is actually more soluble. Also, a simple indicator that the reaction is finished is that bubbles have stopped evolving. Because the reaction generates carbon dioxide there is a danger of asphyxiation, and it is better to do the treatment either in an outdoor tank or in a very well ventilated room.
Small acid corrections (around 1 g/L) can be done in the wine after alcoholic or after malolactic fermentation, and even just before bottling. When deacidifying the wine before malolactic fermentation is important to be careful that the pH does not increase too much. To avoid growth of spoilage bacteria, the pH before MLF should be below 3.4. Use KHCO3 to remove excess acidity before bottling.
White wine TAs are typically higher than in red wines. At target value for white grape must is TA 8 to 11 g/L. Late harvest, botrytized, and ice wines have higher TAs to balanced with the high residual sugar.
How much should I add?
The limit to CaCO3 and KHCO3 addition is the available tartaric acid, so determine this in the must. Plan your CaCO3 or KHCO3 addition to remove excess tartaric acid. However, it is important to leave 0.5 g/L of tartaric acid, otherwise the treated wine will oxidize rapidly at an alkaline pH.
With the double salt method, you take 20 to 40% of the must to be treated and add all the calculated necessary CaCO3. The high pH produced in this fraction of must will also facilitate precipitation of malic acid. After CaCO3, agitate well, let settle and rack. Recombine the treated and non-treated fractions. Mix well. Wait several hours and check the TA and pH.
Calculations:
CaCO3: 0.67 g/L reduces TA by 1 g/L
- (i) (vol.) L x present TA (g/L) – a = desired TA
- (ii) CaCO3 needed = a x 0.67
KHCO3: 0.673 g/L removes 1 g/L tartrate
K2CO3: 0.62 g/L removes 1 g/L
LEAVE O.5 g/L of tartrate
(i) 230 g KHCO3/500 mL %TA x vol (mL) = mL of solution added
Excess Ca in the wine can cause Ca-tartrate instabilities and there is no way to test for this instability. With 0.67 g of CaCO3 you are really only adding 0.268 g of Ca. Wine typically contains 40 to 140 mg/L of Ca; the majority of Ca added to wine will be removed with the precipitate as tartrate and malate salts.
Calculating Wine Additions
Calculating wine additions under duress can be stressful and tricky. We recommend using computers with spreadsheet applications to streamline the mathematics and archive the information. There are several wine-addition websites available that can help calculate particular additions. Example URLs: WineAdds, and Vineology.