VEEN is curated by WSU Viticulture Extension. For questions on articles, or to request to submit an article in future issues, reach out to Michelle Moyer.
This issue of VEEN was originally published as a .PDF in April 2014, and posted online. Some content here will differ from that original issue. The issue is archived, but accessible on the VEEN Archive webpage.
A Note from the Editor
Spring is finally here! Irrigation is set for full allotment this summer, buds are swelling, vines are bleeding, and the inevitable vineyard-tripping-due-to-badger-holes has commenced. It is good to shake off that winter dormancy.
This issue of VEEN is an eclectic mix of rules and research, theory and practice. Washington’s grape quarantines are explained, and a highlight of how the Clean Plant Center – Northwest is keeping our Foundation Grapes clean is presented. Canopy management and mite resistance management research by two recent graduates are discussed, as well as ground-breaking information on how “native” yeasts can be put to good use in the vineyard. Weather from 2013 is explained, and questions on irrigating different soils are answered. We also have part one of a two-part series on fruit and wine acidity.
Click print, or download to your smart device and begin reading—just watch out for those badger holes!
Michelle M. Moyer
Viticulture Extension Specialist
Assistant Professor of Viticulture
WSU Prosser IAREC
Table of Contents
- Understanding Washington Grapevine Quarantines
- Early Fruit-Zone Leaf Removal in Washington
- 2013: A Changeable (and Warm) Weather Year
- Can Indigenous Yeasts Help Control Grapevine Diseases?
- Spider Mites and Acaricide Resistance in Vineyards
- Deep Sequencing: A New Strategy for Virus Detection
- Irrigation in Vineyards with Different Soil Types
- High pH, High TA: The Winemaker’s Conundrum
Connect With Us
V&E Certificate Program
Understanding Washington Grapevine Quarantines
By Michelle Moyer, WSU Prosser
Washington has several unique factors that truly make it the perfect climate for wine. Low rainfall east of the Cascades allows growers to control water; variable growing season lengths and heat accumulation across the state allow for the production of nearly every kind of variety and wine style. One of the biggest advantages to commercial grape production in Washington, however, is the relatively low disease and pest pressure.
Lack of established phylloxera populations allows Washington producers to grow Vitis vinifera on its own roots; a substantial advantage in regions where cold damage is a threat. The lack of native grape species reduces the likelihood of field-infection of the Crown Gall bacterium (Agrobacterium vitis). The warm, dry growing season conditions in eastern Washington make it the envy of other regions; these conditions allow for substantially reduced spray programs for powdery mildew and Botrytis bunch rot. Due to these reduced pesticide inputs, Washington producers are able to sustain high populations of beneficial insects, which keep pest insects (mites, leafhoppers) at manageable levels.
The best defense, however, in Washington’s pest and disease management routine is the relative isolation of the state due to the bordering mountain ranges and ocean, and lack of exposure to, and build up of, other diseases due to the relatively young age of the industry. These factors have protected Washington producers from a range of pests and diseases that threaten the grape industries around the world. The big question is, with the world becoming an increasingly smaller place, how can Washington keep this “isolation” while expanding the industry?
The answer: plant quarantines.
In order to protect its large agricultural industry, Washington has very strict laws on what kinds of plant materials can come into the state. These laws are designed to prevent the introduction of unwanted pests and diseases that could result in collapse of any one of our major crop systems. From a grape standpoint, the general idea behind these quarantines is simple: don’t bring in infested or diseased plant material from out of the state/country.
Specifically, Washington has two quarantines in place for grapes. The first quarantine (WAC-16-481) is directed at reducing the introduction of insect pests, specifically phylloxera (Daktulosphaira vitifoliae) and vine mealybug (Planococcus ficus). The second quarantine (WAC-16-483) is directed at reducing the introduction of three different virus diseases: Fanleaf, Leafroll, and Corky Bark. These quarantines require grapevine materials from outside of the state to show proof that they are free of these pests and diseases before being allowed into the state. This proof is typically a “phytosanitary certificate” issued by the state of origin’s plant regulatory agency.
Under the insect quarantine, both vineyard equipment and grapevine materials are regulated. Equipment originating from out of the state must be thoroughly cleaned of soil and debris before entering the state.
Plant materials, however, must either:
- Be grown in an area that is free of phylloxera and vine mealybug;
- Be grown in sterile media and pass a visual inspection that they are free of the quarantine pests (if the shipment is small, <500 cuttings, the visual inspection is the only requirement needed), if they are from an area that is not free of the quarantined pests; or
- Be subjected to one of two different treatments that reduce or eliminate the quarantine pests. The different treatments that are approved are: Dormant hot water treatment of cuttings or methyl bromide fumigation of dormant cuttings.
Under the virus quarantine, the only legal way grape materials can enter the state is if they are “certified” through a Washington-recognized certification program. The “certified” stamp indicates that the original source plant material came from a grape Foundation Program (has been “cleaned up” of potential diseases) and was propagated and grown at a certified nursery that met strict standards in routine testing of the plant material and vineyard maintenance to maintain the disease-free status of the plant materials. Washington currently only recognizes certification programs from California, Oregon, Canada, and of course, itself. Interestingly, the nursery certification program in Washington tests for and excludes the viruses that cause Stem Pitting and Red Blotch diseases; the California certification program does not. What this means is that certified plant material from California that meet Washington quarantine regulations, may harbor these viruses since they are not specified in the Washington quarantines.
All out-of-state materials are subject to both quarantines. It is the purchaser’s responsibility to make sure all proper notifications are made to the WSDA. Most reputable, certified nurseries will either do this documentation for you, or help you with the process. This translates to: the only way to legally bring in grape material from outside of Washington is if it is “certified” from California, Oregon or Canada, and it comes with a phytosanitary certificate showing it is pest free.
Think “clean” plants. Never plant material from out of state, unless it was certified; it’s the law. Those vine cuttings collected while on a recent out-of-state trip? They are illegal to bring in, plant, or distribute in Washington. Knowledge and experience from other regions can help continue to propel the Washington grape and wine industries forward, but not all legacies are worth sharing.
Note: Quarantines rules can change, please check the Washington State Department of Agriculture’s Plant Quarantines webpage for updates.
Early Fruit-Zone Leaf Removal in Washington
By Brittany Komm, Graduate Student, and Michelle Moyer, WSU Prosser
Early fruit-zone leaf removal (FZLR), the act of removing all or varying degrees of all, the leaves within the fruiting zone in winegrape canopies, has gained research interest in recent years. Studies done around the globe have focused on how the timing and severity of FZLR impact vine growth and development, and fruit quality. Many of these studies have demonstrated that early FZLR can reduce fruit set, which is beneficial in some situations where yields need to be controlled but laws prohibit vineyard activities.
Eastern WA’s unique climate offers growers opportunities to optimize both horticulture and pathology goals in vineyard management. Can early FZLR be implemented as a part of these goals in our climate? This question has been investigated over two growing seasons (2012 and 2013) in commercial blocks of V. vinifera ‘Sauvignon blanc’ and ‘Riesling’ located in Prosser, WA.
How We Evaluated Early FZLR.
In this study, early FZLR was evaluated at: (i) pre-bloom (rachis elongation and individual flowers separating), (ii) bloom (50% of the clusters had 50% of the flower caps removed), and (iii) 4 weeks post-bloom. Fruit-zone leaf removal consisted of removing all leaves from the second cluster down on all count shoots in the canopy, on both sides of the canopy. The same experimental design was carried out in 2012 and 2013; that is, the vines received the same leaf removal treatments in both years.
Impacts of FZLR on Vine Development and Yield
In 2013, total leaf area (TLA) that was removed during each FZLR treatment was evaluated. In Riesling, pre-bloom, bloom and 4 weeks post-bloom FZLR resulted in 60%, 50% and 22% TLA removed, respectively. In Sauvignon blanc, pre-bloom, bloom and 4 weeks post-bloom FZLR resulted in 53%, 35% and 18% TLA removed, respectively.
Total fruit set was also evaluated, and no significant reductions were seen between treatments in either year (p = 0.60, 0.05; Riesling 2012 and 2013, respectively) (p = 0.67, 0.30; Sauvignon blanc 2012 and 2013, respectively). In 2013, however although not significantly different, Riesling pre-bloom and 4 weeks post-bloom leaf removal had higher total fruit set relative to bloom leaf removal (p = 0.06 and 0.09, respectively). Yield components, such as cluster and berry weights were not impacted by early FZLR.
Clusters per shoot, was influenced by early FZLR. Pre-bloom and bloom FZLR resulted in significantly more clusters than later leaf removal or no leaf removal in Riesling (p = 0.0005). This increase in clusters per shoot is likely due to increased bud surface temperatures experienced in the 2012 growing season during the critical time of cluster differentiation in buds. Increased bud exposure to sunlight along with increased temperatures (86-95ºF) from budbreak to bloom, promotes cluster over tendril formation for the following growing season [1].
One of the key champions of early FZLR is improved disease management. Spray penetration was evaluated in 2013 at bloom and again at pre-véraison. During bloom, canopies that had undergone FZLR (i.e., the pre-bloom and bloom treatments) had significantly improved spray penetration (Fig. 1). In some cases, spray penetration doubled compared to canopies that had not undergone leaf removal. At véraison, there were no differences in spray penetration, although the 4 weeks post-bloom leaf-removed canopies trended towards higher spray penetration. This lack of difference at véraison shows that canopy refill can occur late in the season (Fig. 2).
Cold hardiness acclimation was tracked in both years of the study as well. Overall, there were no differences between treatments for overall cold acclimation rates in both years of the study, indicating that early FZLR does not detrimentally impact the various tracks that lead to cold hardiness.
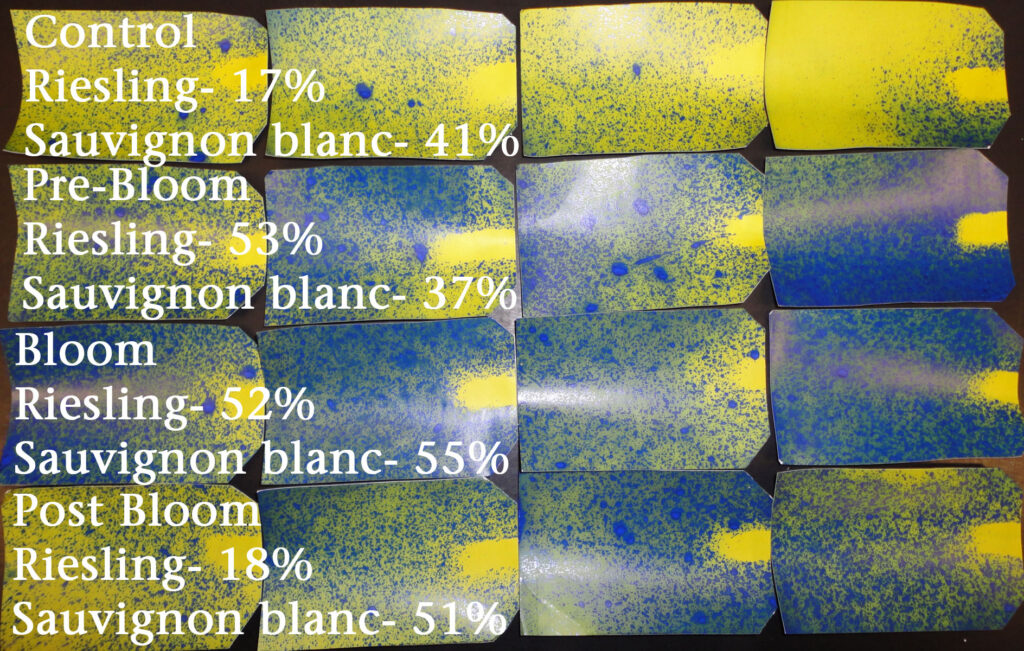
fruit-zone. At the time of assessment, only the pre-bloom and bloom treatments had undergone fruit-zone leaf removal. Average coverage for both cultivars are indicated in the image. Photo by Brittany Komm.
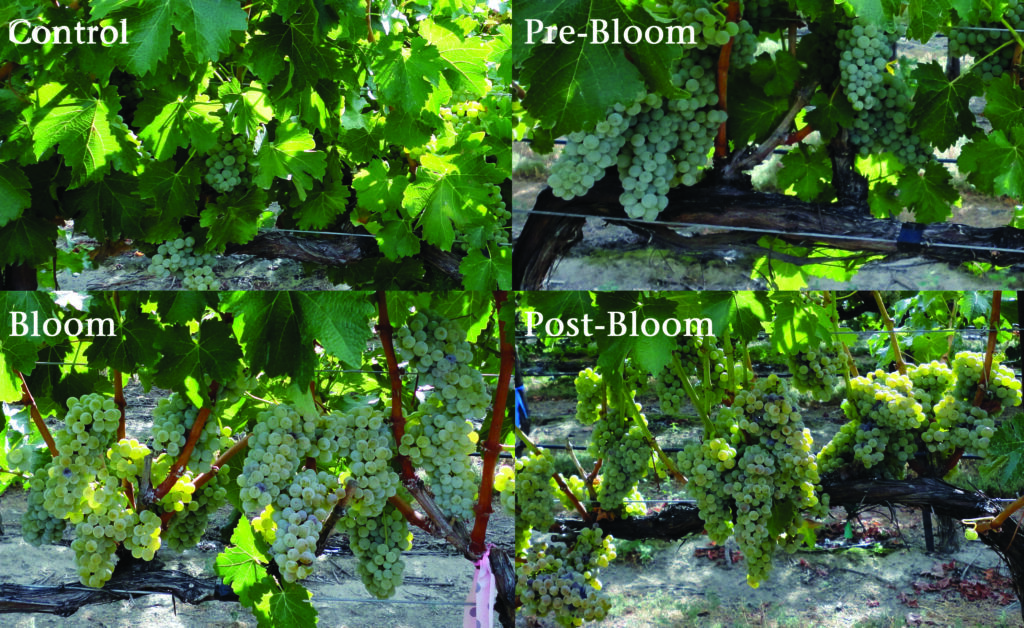
2013 of Sauvignon blanc taken 2 days before harvest. Photo by Brittany Komm.
Impact of Early FZLR on Fruit Quality
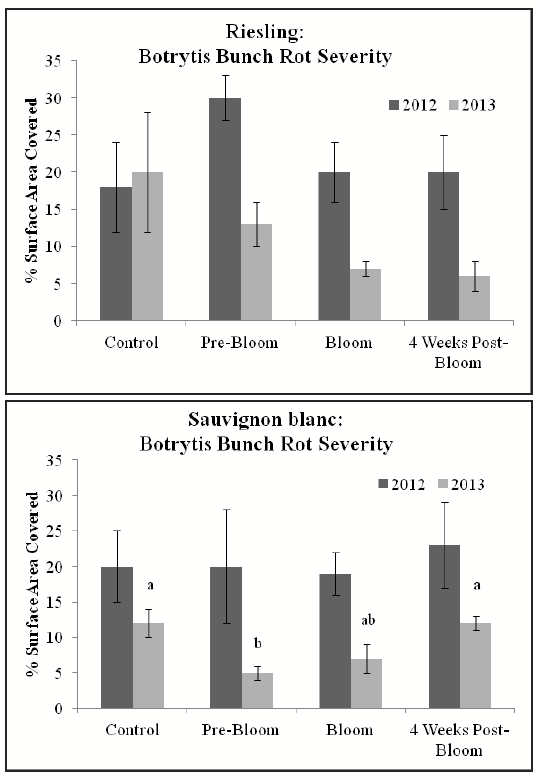
The severity of disease and sunburn of fruit was evaluated in both years of the study. In 2012, no differences in Botrytis bunch rot severity were found in either cultivar at harvest. In 2013, no differences were seen at harvest in Riesling (Fig. 3). In Sauvignon blanc, however, pre-bloom leaf removal resulted in a significant reduction in Botrytis bunch rot relative to the control and 4 weeks post-bloom treatments (p = 0.02, 0.03, respectively, Tukey’s HSD) (Fig. 3). In both years of the study and in both cultivars, implementation of complete, early FZLR, regardless of timing, did not increase severity of sunburn.
Fruit juice was analyzed at harvest for differences in ºBrix, TA and pH (Table 1), but no differences between treatments were seen. Juice nitrogen analysis was conducted both years of this study. In 2012, the Riesling control had a significantly higher free ammonia concentration relative to both the bloom and 4 weeks post-bloom treatments (p = 0.003, 0.0006, respectively, Tukey’s HSD); the pre-bloom treatment also had a significantly higher concentration relative to 4 weeks post-bloom (p = 0.02, Tukey’s HSD). No differences were seen in 2013. In 2012, both the control and pre-bloom treatments in Sauvignon blanc had a significantly higher concentration of free ammonia relative to the bloom and 4 weeks post-bloom treatments (p = 0.0002, and <0.0001,respectively Tukey’s HSD). In 2013, the 4 weeks post-bloom treatment had a significantly higher concentration of free ammonia relative to the bloom treatment (p = 0.02; Tukey’s HSD). Even though significant differences were seen, all concentrations fell into the lower range of Washington’s typical free ammonia levels.
| Leaf Removal Treatment | °Brix: 2012 | °Brix: 2013 | Titratable Acidity (g/L): 2012 | Titratable Acidity (g/L): 2013 | pH: 2012 | pH: 2013 |
|---|---|---|---|---|---|---|
| Riesling: Control | 19.83 (0.50) | 21.88 (0.48) | 10.37 (0.89) | 6.91 (0.16) | 2.91 (0.05) | 3.24 (0.04) |
| Riesling:Pre-Bloom | 19.58 (0.23) | 22.28 (0.13) | 9.71 (0.44) | 6.43 (0.08) | 2.88 (0.07) | 3.29 (0.05) |
| Riesling:Bloom | 19.98 (0.13) | 21.45 (0.27) | 9.21 (0.38) | 7.17 (0.41) | 2.91 (0.06) | 3.2 (0.07) |
| Riesling:4 Weeks Post-Bloom | 19.55 (0.27) | 20.93 (0.45) | 9.19 (0.30) | 7.09 (0.37) | 2.95 (0.07) | 3.09 (0.02) |
| Sauvignon blanc: Control | 21.63 (0.29) | 21.75 (0.60) | 7.49 (0.30) | 6.89 (0.33) | 3.65 (0.07) | 3.33 (0.03) |
| Sauvignon blanc: Pre-Bloom | 21.85 (0.71) | 21.88 (1.41) | 7.16 (1.06) | 6.45 (0.34) | 3.57 (0.06) | 3.32 (0.05) |
| Sauvignon blanc: Bloom | 21.58 (0.77) | 22.75 (0.53) | 7.63 (0.99) | 6.99 (0.10) | 3.57 (0.02) | 3.29 (0.03) |
| Sauvignon blanc: 4 Weeks Post-Bloom | 21.43 (0.58) | 20.98 (0.83) | 6.83 (0.44) | 6.74 (0.43) | 3.56 (0.06) | 3.27 (0.04) |
Aromatic volatiles were analyzed in both years of this study. In 2012, aldehydes were significantly higher in the control treatment of Riesling relative to the bloom treatment (p = 0.04; Tukey’s HSD). In addition, the pre-bloom treatment had significantly more acid volatiles relative to the 4 weeks post-bloom treatment (p = 0.03; Tukey’s HSD). When aldehydes were analyzed on a specific compound basis, the control treatment had a significantly higher concentration of hexanol relative to the bloom treatment (p = 0.03; Tukey’s HSD). In 2013, the pre-bloom treatment had significantly higher terpene concentration relative to the control (p = 0.02; Tukey’s HSD). When terpenes were analyzed on specific compound, the pre-bloom and 4 weeks post-bloom treatment had a significantly higher concentration of nerol oxide relative to the control (p = 0.01, 0.01; respectively, Tukey’s HSD). Significant differences in the compound α-ionone were also seen; the pre-bloom treatment had a significantly higher concentration relative to both the bloom and control treatments (p = 0.003, 0.05; respectively, Tukey’s HSD). The most prominent aromatic volatiles in Riesling are terpenes [3], suggesting that early fruit-zone leaf removal may enhance this Riesling character. No significant differences were seen between treatments for aromatic volatiles in either year for Sauvignon blanc.
Skin and seed tannins and phenolics were also analyzed. Statistically, skin tannins and phenolics were lower in the control treatment relative to all other treatments. This was not a surprise, as past research has shown that when clusters are shaded, total tannins and phenolics tend to be lower then sun-exposed compared to fruit from vines where FZLR was implemented [2].
Early FZLR: Adoption in Washington
Early FZLR did not result in reduction in fruit set or increased sunburn, as past studies may have suggested. Spray penetration was significantly improved during bloom, when critical preventive tactics are deployed to prevent various diseases.
It appears that the hot and arid climate of eastern Washington is conducive to implementing FZLR prior to or even during bloom, without seeing any negative side effects on vine development and fruit quality. However, implementing FZLR prior to or during bloom would have to be done manually. Current mechanical leaf removal devices are not engineered to be deployed this early in canopy and fruit development. However, this earlier timing of FZLR may coincide with vineyard activities such as shoot thinning.
References
- Butrosse, M.S. 1970. Fruitfulness in grape-vines: the response of different cultivars to light, temperature and daylength. Vitis. 9: p. 121-125.
- Ristic, R. et al. 2007. Exclusion of sunlight from Shiraz grapes alters wine colour, tannin and sensory properties. Australian Journal of Grape and Wine Research. 13 (2): p. 53-65.
- Marais, J. 1983. Terpenes in the aroma of grapes and wines: a review. South African Journal of Enology and Viticulture. 4 (2): p. 49-58.
2013: A Changeable (and Warm) Weather Year
By Nic Loyd, WSU AgWeatherNet
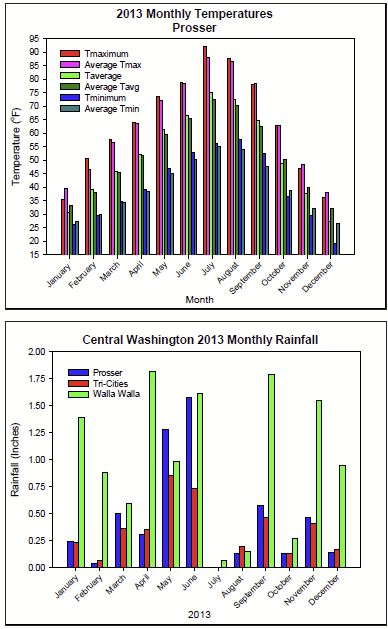
Although annual mean temperatures in Washington were only slightly above average, the 2013 weather was anything but normal. Below average temperatures in January and again from October to December served to balance out a very warm interim period.
Prosser, WA’s warm season (April to September) temperatures were 1.7 degrees above average, and 2.4 degrees above average at night (Fig. 1). The April 1 to October 31 accumulated Growing Degree Day (GDD; ˚F) value was 2851, 297 units above the 5-year average (Table 1). In fact, Prosser experienced several notable monthly climate occurrences last year, including the warmest monthly mean high temperature on record for any month (July, 92.1˚F), the warmest monthly mean low temperatures on record in August and September, the warmest August since 1991, and the second warmest summer on record (1990 to present). By contrast, the December mean low temperature was 7.2 degrees below average. That is the largest (positive or negative) monthly temperature anomaly since December 2009.
| Location | Accumulated Growing Degree Days (Base 50˚F): 2013 | Accumulated Growing Degree Days (Base 50˚F): 5-year Average | Accumulated Growing Degree Days (Base 50˚F): Difference |
|---|---|---|---|
| Prosser (WSU IAREC) | 2851 | 2554 | 297 |
| Tri-Cities | 3332 | 3097 | 235 |
| Walla Walla | 3046 | 2769 | 277 |
The seasonal distribution of eventful weather was also highly variable in 2013. Conditions were relatively benign during the normally active and wet months like January/February and October to December (Fig. 1). Meanwhile, most of the active weather occurred during unlikely times, such as August and September. It is noteworthy that several west-side locations like Vancouver and Seattle, which experienced more precipitation (P) than evapotranspiration (ET) in 2012, recorded net negative (P – ET) values in 2013. At Vancouver, (P – ET) was +7.53 in 2012, but -12.24 in 2013.
There were numerous significant meteorological events in 2013. An early May heat wave sent temperatures soaring into the 90s across eastern Washington, while cool and wet weather later in the month kept high temperatures at some of the same locations below 50˚F on 22 May. Another major heat wave on 1 and 2 July sent temperatures east of the Cascades soaring into the 100s. Like its May predecessor, the July hot spell was the earliest heat wave of such magnitude since 1992. Otherwise, July was hot and dry, with record heat in the east and record dryness in the west. August was unusually humid, which aided in the development of several episodes of thunderstorms. September was warm and stormy. On 15 September, a line of strong thunderstorms raged through central Washington, with 60 mph winds and heavy rain squalls. The high temperature of 101˚F at College Place was the latest occurrence of a +100˚F temperature in the history of AgWeatherNet. September ended with an epic 3-day storm that dropped more than 5 inches of rain at East Olympia, while also bringing heavy snow to the mountains, and winds of over 70 mph to Huntsville. Finally, an early December arctic outbreak was responsible for some of the coldest temperatures since late November of 2010. Although the annual average conditions paint a dull picture, a closer inspection of last year reveals a diverse array of anomalous weather events that combined to make 2013 a year to remember.
Further details about Washington’s weather and climate are available at AgWeatherNet.
Can Indigenous Yeasts Help Control Grapevine Diseases?
By Leslie Holland and Elizabeth Kramer, Graduate Students; Dean Glawe, WSU Pullman; and Gary Grove, WSU Prosser
Each year grape growers and winemakers in Washington State and around the world contend with reductions in yield and quality caused by powdery mildew (caused by Erysiphe necator) and Botrytis bunch rot (caused by Botrytis cinerea). Proven management strategies include the use of fungicides and managing canopy vigor. While effective, these activities are costly and fungicides can reduce populations of beneficial vineyard organisms. New management strategies that maintain effective levels of disease control while reducing production costs and the non-target effects of fungicides would benefit the industry.
In the search for alternative options for managing these diseases, researchers at Washington State University are studying the possible effectiveness of naturally-occurring yeasts as biological control agents (Fig. 1). Scientists estimate that there may be as many as 1.5 million species of yeasts in the world; only 1% of which have been studied. Yeasts are ubiquitous—they can be found on plants, in soil, on machinery, on and inside insects and other animals, and in the air.
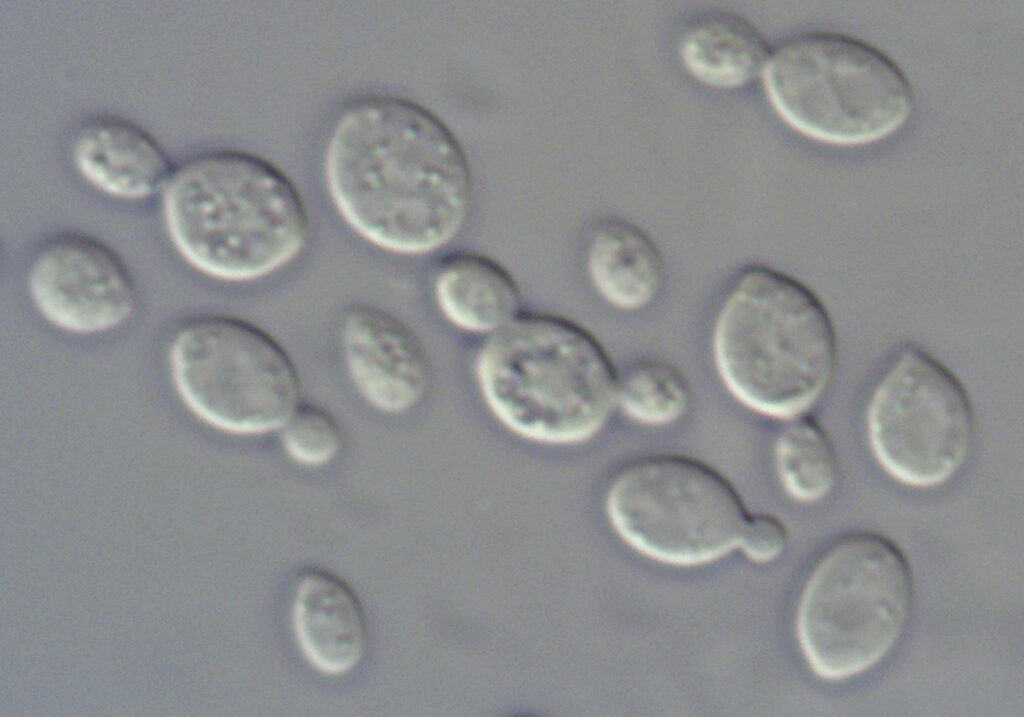
Over the past several years we and our coworkers have identified more than 60 species of yeasts occurring on grape leaves or berries in Washington. Many of the species were unknown in North America, and several are new.
Ten of these newly-isolated strains limit growth of B. cinerea in laboratory assays (Fig. 2) and now are being evaluated for reduction of Botrytis bunch rot.
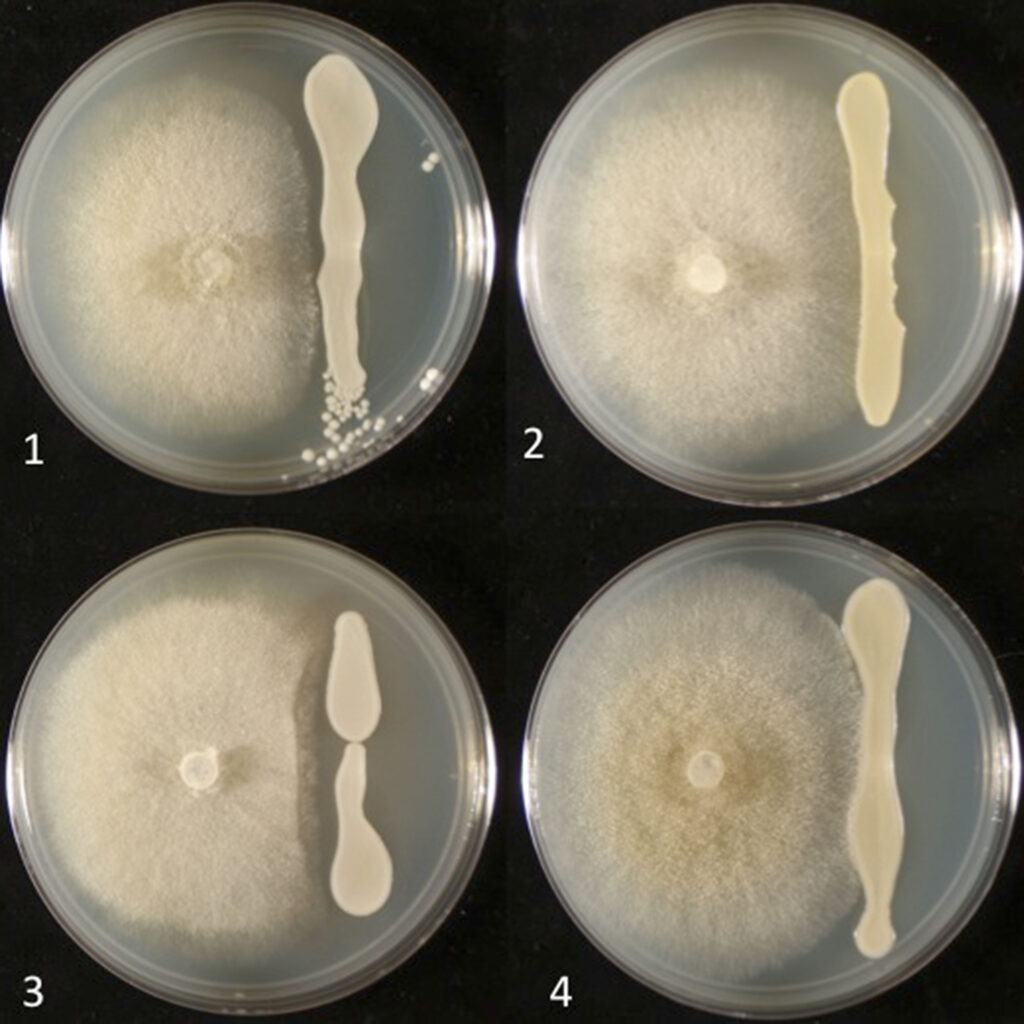
In laboratory tests several of these B. cinerea-inhibiting yeast strains were insensitive to fungicides used in vineyards, which raises interesting questions for further research. For example, would it be possible to apply one or more of these fungicide-resistant yeasts along with a fungicide in a tank mix? Such a combination could provide initial pathogen knock-down by the fungicide as well as longer term suppression of pathogens by the yeasts. Alternatively, knowing more about the biology of these yeasts could enable growers to manage vineyards in ways that enhance the biocontrol activity of yeasts already present in vineyards.
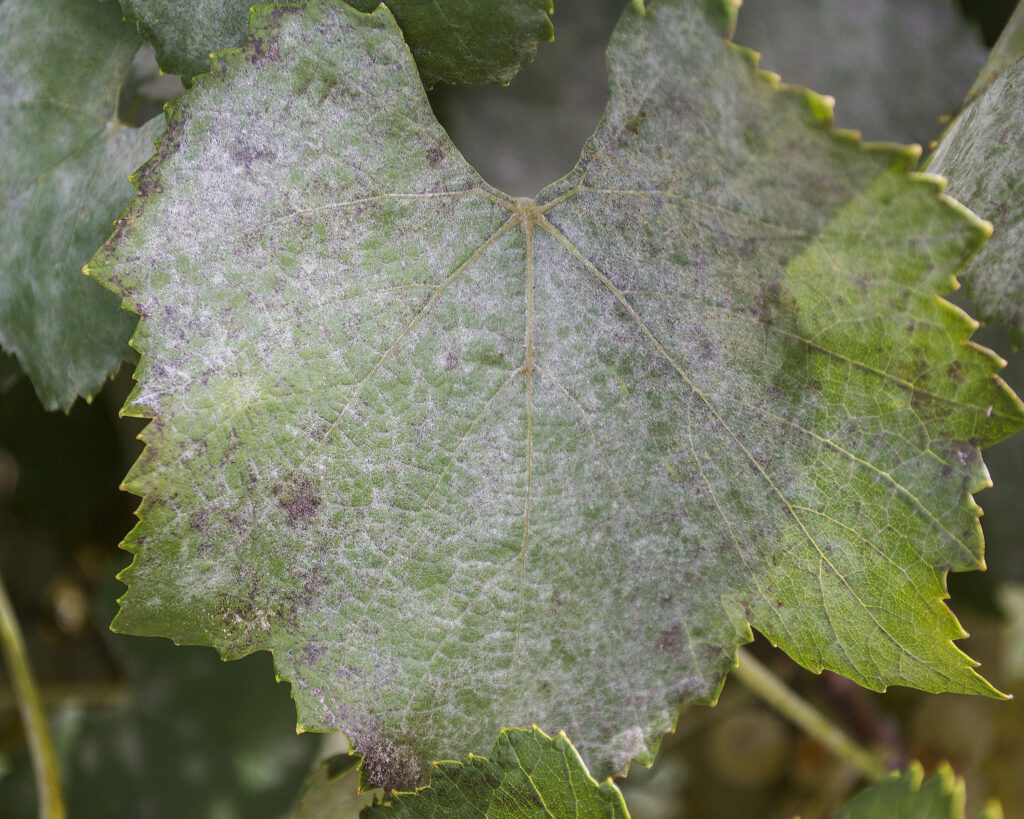
We also have isolated a number of yeasts from powdery mildew colonies on grape leaves. Leaves are the primary source of powdery mildew inoculum (Fig. 3). While no research on interactions of yeasts and E. necator has been done previously in our region, researchers in other regions have found yeasts that parasitize or suppress powdery mildews. This year we will conduct our first tests to determine if locally-occurring yeasts can reduce E. necator growth or spore production.
We are only beginning to understand the roles of these previously ignored fungi in Washington vineyards. Our results so far suggest that indigenous yeasts likely interact with foliar and fruit pathogens in ways that, if we can learn to manage them, may offer new tools for Washington grape growers and winemakers in their quest to make unique, highly-valued premium wines.
Spider Mites and Acaricide Resistance in Vineyards
By Tara Piraneo, former Graduate Student, and Douglas Walsh, WSU Prosser
Wine grapes are periodically attacked by a suite of arthropod pests, and damage from feeding or contamination of fruit can result in economic loss. Historically, spider mites were damaging in Washington State vineyards, but the industry-wide shift away from applying organophosphates in the early 2000s has resulted in an improved balance of natural enemies in our vineyards. As a result, spider mite abundance has remained low over the past decade.
Unfortunately, in 2013 many Washington State winegrape growers experienced outbreaks of Willamette spider mite (Eotetranychus willamettei) and McDaniel spider mite (Tetranychus mcdanieli). Two-spotted spider mite (Tetranychus urticae; Fig. 1) was sometimes observed, but at lower population densities. We speculate that the hot summer in 2013 contributed to the outbreak of spider mites. Outbreaks are intensified by warmer temperatures and extreme diurnal fluctuations in humidity; conditions were prevalent in 2013. Increased temperatures up to a threshold of ~95°F increases spider mite development and mites can mature from egg to adult in as little as 7-8 days. Fungicides, insecticides and fertilizers applied in the vineyard can also disrupt the interactions between spider mites and their natural enemies. We speculate that the increase in insecticides applied for grape mealybug in the past several years has contributed to spider mite outbreaks.
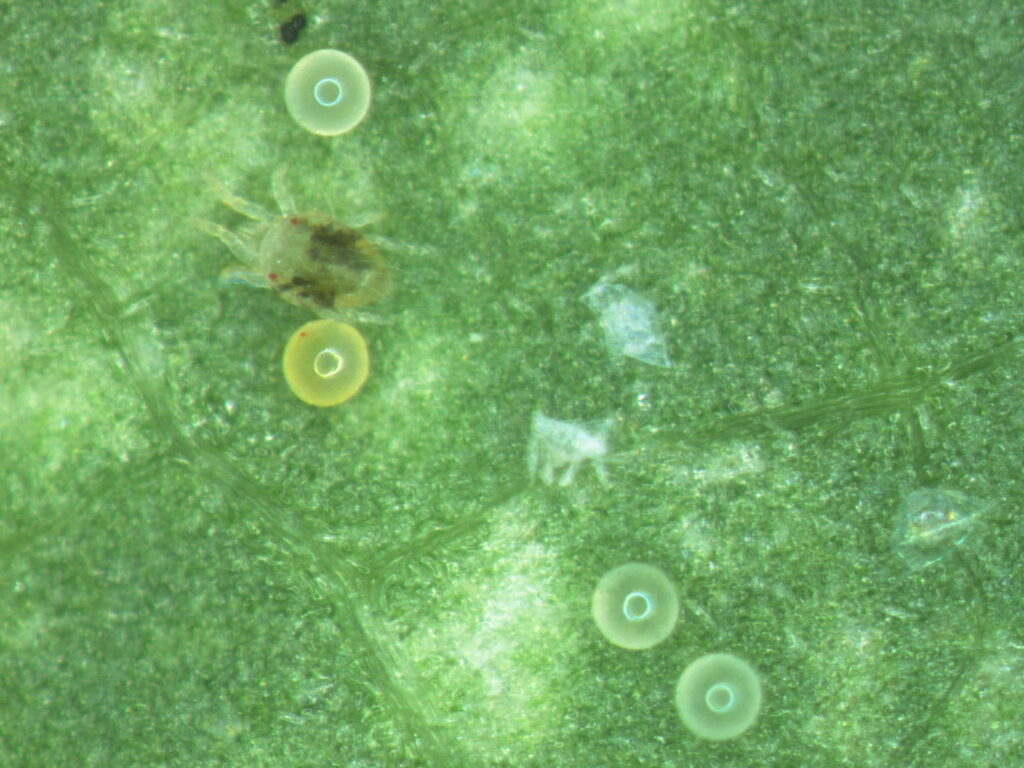
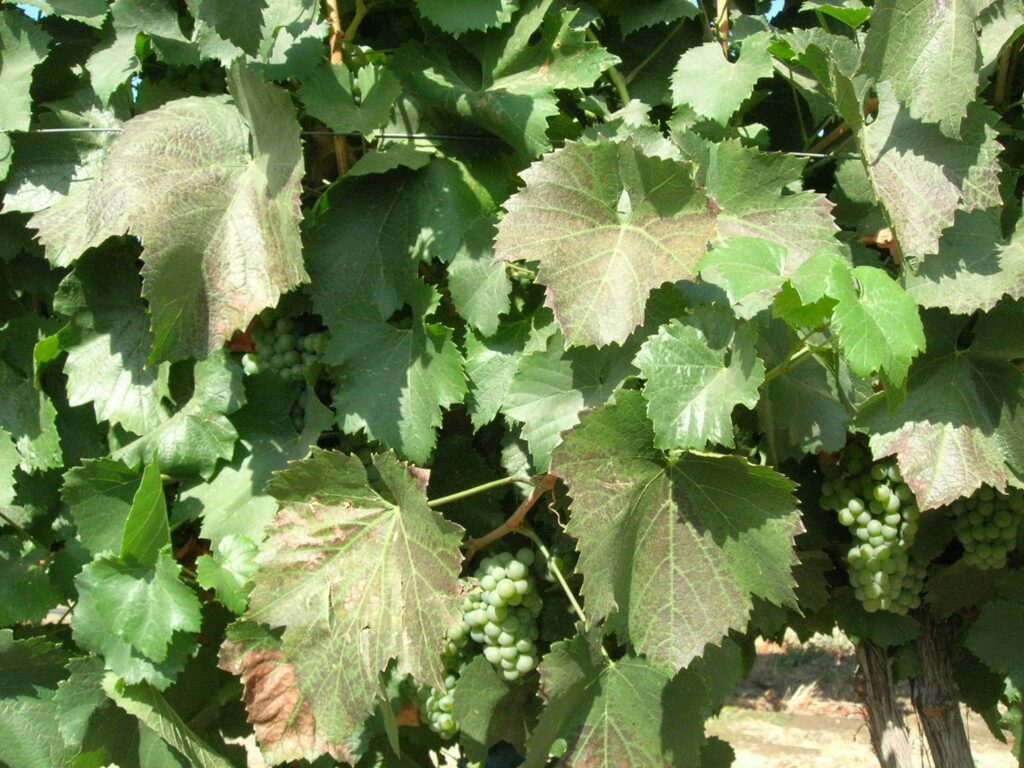
When spider mite infestations result in visible plant injury (Fig. 2) growers will often apply an acaricide to control these outbreaks. Spider mites as pests are well documented for rapidly developing resistance to the acaricides. Summer 2013 provided us with an opportunity to assess spider mite resistance levels in Washington State vineyards.
To monitor for acaricide resistance in Washington wine grapes, spider mites were collected from several vineyards that experienced outbreaks. We focused specifically on the toxicity of Acramite (bifenazate), as it is a commonly used acaricide in vineyards. The toxicity testing consisted of a leaf-disc bioassay, which is a frequently used method to assess the susceptibility of spider mites to various insecticides/ acaricides.
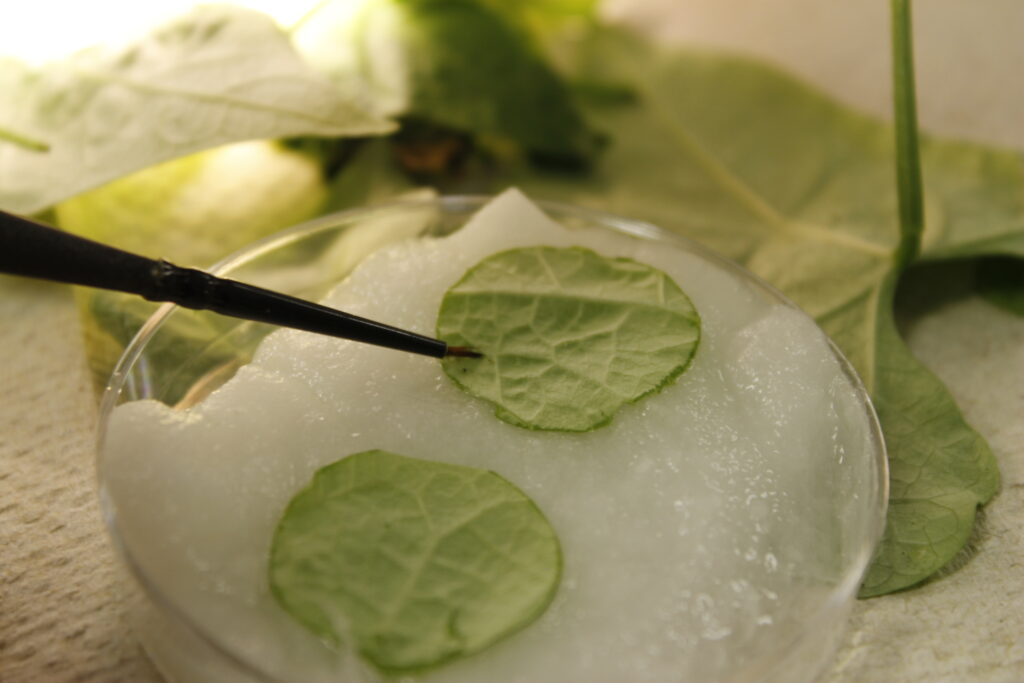
In our studies, cohorts of 10 adult female spider mites were placed on leaf discs (Fig. 3). The cohorts of spider mites placed on these leaf discs were exposed to a range of concentrations of Acramite in a topical mist application using a Potter Spray Tower. Mortality was evaluated at 24 hours post spray application. This allowed for sufficient exposure time to kill those mites susceptible to the acaricide at that concentration, and allowed those that were resistant to survive.
Results of the bioassays revealed high mortalities to Acramite, suggesting that spider mites in Washington vineyards are highly susceptible to this acaricide. All the spider mites exposed to the recommended field rate or 50% of field rate of Acramite died. At 25% of the field rate, one population experienced 95% mortality, and another was recorded at 98% mortality. Additionally, vineyard field observations demonstrated that Acramite was highly effective at suppressing mite outbreaks.
These results directly contrasted with spider mite populations from hopyards, where we observed increased levels of tolerance of the two-spotted spider mite to exposure to Acramite.
In a separate laboratory-based experiment, populations of susceptible acaricide spider mites were exposed to repeated doses of Acramite and Agri-mek (abamectin). In these studies, we concluded that spider mites could gradually increase tolerance to the acaricides. After a series of ten exposures of Agri-mek and Acramite, spider mites increased resistance by 27-fold and 14-fold, respectively.
Conclusion
Caution should be taken when applying acaricides to control spider mites. Our data suggests that repeated acaricide treatments in the vineyards could result in increased tolerance by spider mites, thus making them harder to control. Fortunately, our data demonstrates that spider mites in vineyards are not currently resistant to acaricides. However, we do recommend the prudent and judicious use of acaricides in the future to prevent the establishment of resistance.
Deep Sequencing: A New Strategy for Virus Detection
By Dan E. Villamor, Gary Ballard, and Kenneth Eastwell, WSU Prosser and Clean Plant Center Northwest
When a vine becomes infected by a virus, it remains infected throughout its lifetime. Unlike fungal and bacterial pathogens, which can often be controlled by fungicides and bactericides, chemicals effective in combating plant viruses have yet to be commercialized. For this reason, the use of virus-free planting materials (clean plants) has long been the first line of defense against viruses in a vineyard.
The grapevine Foundation Program of the Clean Plant Center Northwest (CPCNW) produces grapevines free of economically important pathogens from which certified grapevines are produced. The entire Foundation collection is screened routinely for new and known pathogens. This vigilance is essential to protect the prized collection of grape cultivars that is the backbone of the wine industry in Washington State and the Pacific Northwest.
Freedom from pathogens is verified through molecular, serological and biological assays:
- Molecular assays: This type of test detects the presence or absence of a pathogen-specific genetic fragment within the vine. Reverse transcription polymerase chain reaction (RT-PCR) is currently used to detect 19 RNA-based viruses. Since RNA viruses can have genomes that vary, several of the viruses are tested by more than one RT-PCR test. Thus, a total of 27 RT-PCR reactions are performed for each grapevine in the Foundation Program. PCR tests are also performed for Agrobacterium vitis (bacterial that causes Crown gall), Xylella fastidiosa (bacteria that causes Pierce’s disease) and phytoplasmas (which cause diseases such as Bois noir, Flavescence dorée, and grapevine yellows).
- Serological assays: This test detects pathogen-specific proteins within the vine using specific antibodies. CPCNW currently adopts the method known as enzyme linked immunosorbent assay (ELISA) to complement molecular assays. This test is useful for annual screening of the Foundation vineyard for viruses such as the Grapevine leafroll associated viruses 1 through 9.
- Biological assays: These tests are based on directly infecting specific herbaceous and woody plants, which are known to produce very specific disease symptoms when infected with virus-like agents. Extracts from the grapevine source is used to inoculate four different herbaceous plant species in environmentally-controlled greenhouses. The plants are carefully watched for the appearance of virus-induced symptoms. Woody indexing includes the establishment and maintenance of field plantings throughout the growing season. They are observed for two years. For some viruses, the two-year old vines are harvested and the bark stripped to look for underlying damage to the wood.
For more than 20 years, these assays have been the cornerstone in ensuring the production and release of certified planting materials. The success of these assays are attributed to the ability of the assays to detect pathogens even when the original grapevine seemingly expresses no visible symptoms.
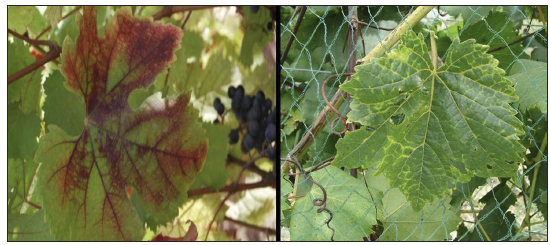
The CPCNW program is constantly reviewing and updating its procedures to provide the best security possible for maintaining virus-free planting materials. For example, two viruses with DNA genomes were recently described in the literature: Grapevine red blotch associated virus (GRBaV) and Grapevine vein clearing virus (GVCV) (Fig. 1). Since these viruses are different than the viruses that are already being tested for, new protocols were needed in order to detect them.
The testing protocols for these DNA viruses were obtained from leading researchers; all of the vines in the CPCNW Foundation vineyard were tested to determine if any of them were infected. One recently introduced cultivar was positive for GVCV; this vine was promptly removed from the Foundation Program. Tests for these viruses are now incorporated into the standard testing protocols at the CPCNW.
The next step forward. Although there are some exceptions, molecular and serological assays generally depend on knowledge of already-described viruses, and they rely on this information to test for specific viruses that are likely to be present in a sample. Since each molecular assay targets a unique genetic sequence of the pathogen, the specificity and sensitivity of these assays have made PCR an important component in the detection method toolbox.
However, new methods of genetic testing, termed deep sequencing (also known as Next Generation Sequencing), have been developed and can now provide a snapshot of ALL of the genetic information in a plant, including pathogens known and unknown, based on its general approach rather than the specific approaches in past molecular assays.
The cost for deep sequencing is decreasing rapidly, and the technology is now being employed routinely. The expanding use of this technology is revolutionizing the science of pathogen detection. Deep sequencing offers many advantages over existing methodologies: the sensitivity of deep sequencing exceeds that of PCR or ELISA and, because deep sequencing is not limited to knowledge of known agents, it is capable of detecting unanticipated pathogens, even in an apparently healthy vine. In grapevine virus research, deep sequencing has revealed previously uncharacterized plant viruses in seemingly healthy vines [1,2], and viruses associated with Syrah decline [3], grapevine vein clearing, and red blotch diseases of grapevines [4-6].
Deep sequencing is available in different platforms [7-8], but the overall procedure can be summarized in three steps:
- nucleic acid (total RNA, total DNA, double stranded RNA and/or small RNAs) is purified from the source organism (i.e., the grapevine)
- these purified nucleic acids are converted into a form appropriate for statistical analysis; and
- the results from these analyses are used to develop a pathogen diagnosis.
To increase the reliability of pathogen detection at the Clean Plant Center Northwest, deep sequencing is being evaluated for use as a routine diagnostic tool. As part of this evaluation, thirty grapevine selections from the Foundation vineyard were subjected to deep sequencing. In most cases, the result confirmed the virus-free status of the vines (Table 1). However, deep sequencing also detected the presence of an isolate of Rupestris stem pitting associated virus (RSPaV) that had escaped detection in prior testing. Additionally, it confirmed the presence of the DNA-virus GVCV that was detected by PCR. Without additional RT-PCR tests, deep sequencing also revealed the status of viroids (virus-like organisms) in grapevines. Viroids are considered latent in grapevines but awareness of their presence could be used to promote higher phytosanitary standards in the future. Preliminary assessments indicate that deep sequencing may also work for detection of pathogenic bacteria.
| Grapevine Selection | Pathogens Detected by Current Proceedure1 | Pathogens Detected by Deep Sequencing. |
|---|---|---|
| 00gr11 | none | HSVd |
| 00gr23 | none | HSVd, GYSVd-1 |
| 03gr03 | none | HSVd, GYSVd-1 |
| 00gr29 | none | HSVd |
| 00gr21 | none | HSVd, GYSVd-1 |
| 00gr19 | none | HSVd, GYSVd-1 |
| 00gr17 | none | HSVd, GYSVd-1 |
| 00gr05 | none | HSVd, GYSVd-1, GYSVd-2, AGVd |
| 00gr22 | none | RSPaV, HSVd, GYSVd-1 |
| 07gr21 | GVCV | GVCV |
These results are promising; deep sequencing technology is now being evaluated at CPCNW on a larger scale. It appears that deep sequencing will provide more reliable detection of pathogens than existing technologies allow, and will aid in the provision of healthier grapevine clones for propagation at certified nurseries. Once the reliability of the technology is verified, acceptance by the regulatory community is needed before full implementation of the new technology can occur.
Deep Sequencing Explained
Deep sequencing data consists of short “reads” of genetic segments; one can think of them as individual words. These short read segments are assembled by a computer into longer sequences known as contigs, by carefully matching and aligning overlapping small sequences. This is akin to taking a scrambled sentence and re-ording the words to form a coherent one.
The resulting contigs from a sample are then compared to a public database of genetic information. In some cases, contigs will show a significant match to a virus sequence (or any plant pathogen); this is then considered a “positive” identification that the plant source was infected by that virus (or other pathogen). In other cases, contigs may be similar, but not an exact match. In those cases, closer examination is needed, and additional tests, such as PCR or RT-PCR for the particular sequence revealed by the deep sequencing contig is needed. These extra measures are taken to make sure there are no “false positives” which can result in unnecessary alarm and plant destruction.
References
- Sabanadzovic, S., Ghanem-Sabanadzovic, N.A. and Gorbalenya, A.E. 2009. Virology 394:1-7.
- Giampetruzzi, A., Roumi, V., Roberto, R., Malossini, U., Yoshikawa, N., La Notte, P., Terlizzi, F., Credi, R. and Saldarelli P. 2012. Virus Res. 163:262-268.
- Al Rwahnih, M., Daubert, S., Golino, D. and Rowhani, A. 2009. Virology 387:395-401.
- Al Rwahnih, M., Dave, A., Anderson, M.M., Rowhani, A., Uyemoto, J.K. and Sudarshana, M.R. 2013. Phytopathology 103:1069-1076.
- Poojari, S., Alabi, O. J., Fofanov, V. Y., Naidu and R. N. 2013. PLoS One 8:e64194.
- Zhang, Y., Singh, K., Kaur, R. and Qiu, W. 2011. Phytopathology 101:1081-1090.
- Glenn, T. 2011. Mol. Ecol. Resources 11:759-769.
- Radford, A.D., Chapman, D., Dixon, L., Chantrey, J., Darby, A.C. and Hall, N. 2012. J. Gen. Virol. 93:1853-1868.
Irrigation in Vineyards with Different Soil Types
By Troy Peters, WSU Prosser
Vineyards are irrigated on a block-basis. However, there are often very different types of soils, and thus different levels of water-holding capacity and drainage within these blocks. This can cause problems since the areas with lower water holding capacity (sandy, rocky, or shallow soils) will run out of water sooner than areas with higher water holding capacity (silt, clay, or deep soils). In the case of variable vineyard soils, you have the choice to:
- irrigate to meet the needs of the sandy area,
- irrigate to the silty soils, or
- irrigate to some “average” condition.
We used the free mobile irrigation scheduling tool on AgWeatherNet to simulate these different strategies and evaluate their effects on soil moisture content in an example vineyard with both fine sand and silt loam soils. The results are below.
Managing for Sandy Soils
What would happen to soil moisture content if this block were managed as if it were a fine sand only? Figure 1 shows a soil water content of the sandy soil that was irrigated for sandy soils, such that there was no water stress (soil water content remained between the full line and the first water stress line) and limited water loss to deep percolation (leaching). This includes a growing root zone which accounts for the upward sloping lines (increasing soil moisture content) in the first part of the growing season. Because the water holding capacity of sands is small, frequent irrigation of small amounts (green squares) are required to avoid water stress and losses to deep percolation.
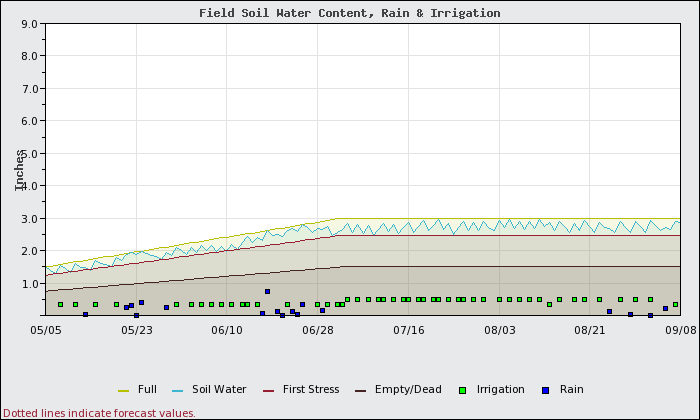
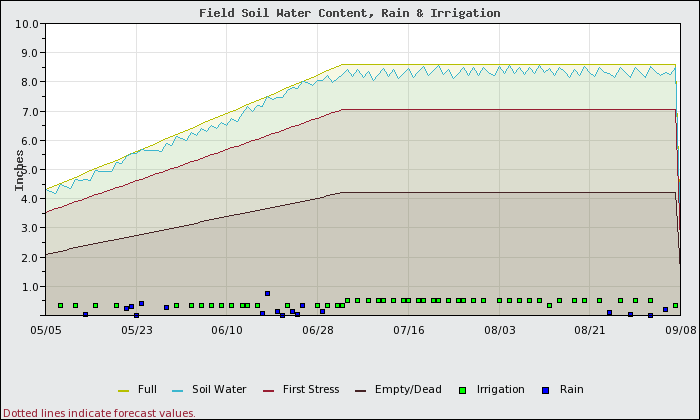
Figure 2 shows how the silt loam soil section of this same block would fare when the block is managed for no stress or water loss as if it were a sandy soil. The applied irrigation is exactly the same on the same dates for both scenarios. Under this management scenario, the following results are seen:
- No water stress in either block.
- Total vine water use and loss to deep percolation in both the sandy and the silt soils of the block are the same.
- Yields are the same in both areas.
- At the end of the season, the silt soil will have much greater residual water available than the sand.
Managing for Silt Soils
What if the water for the whole block is managed for the silt soils in the block? The soil water content on the silt soils over time is shown in Figure 3. In this case, much more water can be applied at each irrigation event and these events can be much less frequent.
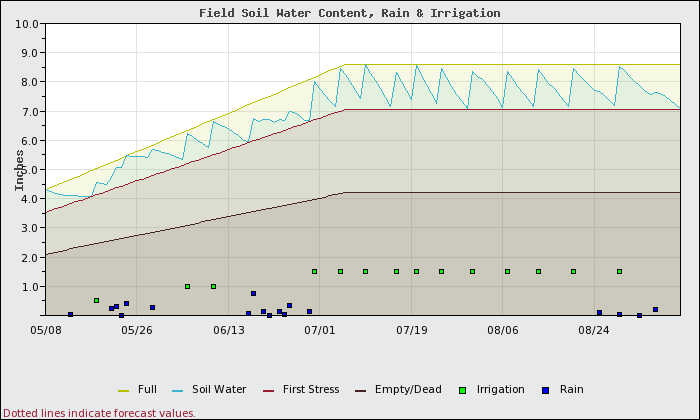
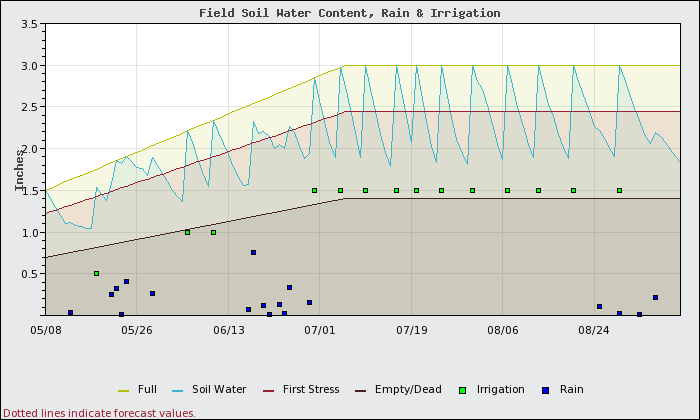
Figure 4 shows how the sandy areas of the block would fare if the water was managed as if it were a silt soil. While the same amount of water is applied on both the silt and the sand sections, in the sandy areas:
- 3.4 inches MORE water is lost to deep percolation.
- There is a 17% yield reduction due to water stress.
- The vines would use 4 inches LESS water in the sandy areas due to shutting down as a result of water stress.
Sometimes growers will put additional drip emitters into the lines in the sandy spots or use higher flow drip tubing in those areas to apply more water per irrigation event to combat potential water stress. Since sandy soils do not have high water holding capacity, all of this additional applied water is mostly lost to deep percolation (leached). Adding more water at each irrigation event to compensate for low water holding capacity is inappropriate. To reduce water stress in sandy areas, more frequent applications of smaller amounts are needed.
Conclusion
From this we can see that on variable soils, if we want to achieve maximum growth from all of the vines, then the entire block should be managed for the soil with the lowest water holding capacity (sandy, rocky, or shallow soils). This means more frequent irrigation events of smaller amounts of water per event.
If the block is subjected to deficit irrigation, then achieving the same level of deficit or water stress in the different soils will be difficult. Sandy areas will be at extreme water stress when the silty soils still have plenty of water remaining. For proper deficit irrigation management and a uniform performance from the field, the irrigation events for the different soils will need to be managed separately. This means re-plumbing the irrigation system to be able to control the water to the silty areas separately from the sandy areas. If done correctly approximately the same total amount of water will be applied to both areas.
More information on vineyard irrigation management can be found at the WSU Irrigation and Water Management webpage.
High pH, High TA: The Winemaker’s Conundrum
By Jim Harbertson, WSU Prosser
This is part 1 of a 2-part series on grape and wine pH and titratable acidity.
Part 1: Defining Acidity
Wines or juice that have a high pH and high titratable acidity (TA) are the winemaker’s conundrum; even though the wine has a high concentration of titratable acids the pH of the wine indicates the wine is not acidic. But how is this possible? The answer lays in the understanding of how acidity is determined in the grape and/or wine, and how it is measured. Acidity is a fundamental aspect of grape and wine composition. Acids are the second most abundant component in grapes, and correspondingly, in wine. Sensorially acids are sour, can augment astringency and their sourness is masked by sugars. From a chemical standpoint they are responsible for multiple important aspects of wine. Acids take part in esterification reactions, catalyze hydrolytic reactions and impact red wine color.
Grapes Contain a Mixture of Organic Acids
The two most abundant acids present are tartaric and malic. Tartaric acid is stable to metabolism, while malic acid can be metabolized during grape ripening and fermentation by bacteria and yeast. Both tartaric acid and malic acid have two acidic functional groups, but malic acid is a significantly weaker acid with a difference of 0.5 pH units between the first acidic functional group’s disassociation constants. This mixture of acids plays a significant role in the buffering capacity of the juice; due to the different chemical species available, the buffering capacity extends over a larger pH range, reducing the likelihood of sudden pH changes that could be detrimental to yeasts.
The basic methods by which various indicators of acidity are measured are simple. The main measure of acidity is pH, which measures the equilibrium protons (H+) in the sample. pH is a log scale; a change in a single unit (such as 3.0 to 4.0), represents a ten-fold difference in proton concentration. As such, the differences in juice or wine pHs seen are on smaller scale. For example, during malolactic fermentation, an increase in pH on the order of 0.2 pH units is generally observed. Titratable acidity, a second measure of acidity, represents the total number of acids in the wine. This is done by titrating the juice or wine sample with base to a chosen pH endpoint; in the USA, this endpoint is 8.2 pH units. Typically, the value is lower than the expected measure from the actual organic acid concentrations.
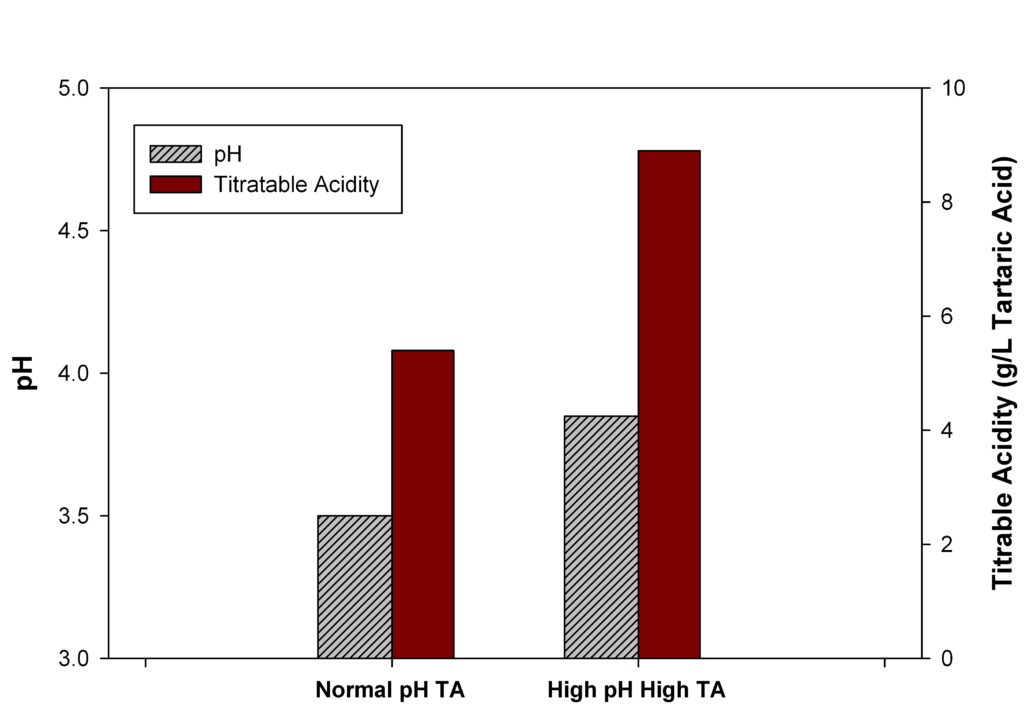
Under normal conditions there is an inverse relationship between the TA and pH of a juice or wine sample (i.e., as the TA of a juice or wine sample increases, the pH tends to decrease). However, this general “rule” doesn’t always play out in the vineyard and wine, thus our pH – TA dilemma. How is it possible to have high pH and high TA simultaneously, if they normally are inversely related (Fig. 1)? To understand this we will need to first understand events that occur during grape ripening to gain insight into this problem.
Acid Development in Grapes
During ripening, as the berry size increases due to water engorgement, compounds synthesized within the berry must also be increased otherwise they become diluted. In the case of malic and tartaric acids, the synthesis of both continue until véraison, where synthesis then stops and their concentration within the berry declines due to dilution. Unfortunately, dilution isn’t the only cause for decline of malic acid, which is also lost due to berry respiration. During respiration, malic acid is converted by the malic enzyme into pyruvate, carbon dioxide and the reduced co-factor NADPH. The conversion of malic acid to pyruvate consumes protons and thus increases the pH of the cell. Tartaric acid, on the other hand, is stable to grape metabolism.
Berry respiration occurs during the day and night; the degree of malic acid breakdown is thought to be dependent on the overall sustained high temperature. Large temperature differentials between day and night can dampen respiration that occurs during the evening, which then preserves malic acid. In regions where there is not a large change between day and night temperatures (i.e., warm nights), malic acid is readily metabolized. Unfortunately the absolute temperature differentials required for malic acid preservation are unknown, making the phenomenon difficult to predict. Most current knowledge on the subject of malic acid preservation and abundance in fruit assumes that the final malic acid concentration in grape juice is due to its preservation, not to its initial synthesized amount.
To complicate the acid situation, inorganic ions (e.g., potassium [K+], sodium [Na+]) are pumped into the berry via the plants vascular system. For each inorganic ion pumped into the berry, there is an exchange of a proton (H+) out of the berry. Because of the concentrations of acid in grapes are high the pH of the grapes would actually be nearly pH 2.5, but because of this proton exchange, the observed fruit pH is in the range of 3.0 to 4.0.
The most important of the inorganic ions is potassium (K+). The net effect of this is an increase in pH of the fruit because of a loss of the protons. The amount of potassium or sodium exchange that occurs is dependent on the concentration of potassium or sodium in the soil, the vine’s ability to uptake said nutrient, and the amount of nutrient recycle that occurs after véraison as the canopy nears senescence.
Thus, the pH of the fruit is dependent upon the concentration of organic acids, their relative strengths and the extent of proton to inorganic ion exchange. The most common way of getting a wine with high pH and high TA is to have a large amount of inorganic ions that have exchanged into the fruit.
This can be numerically demonstrated with the following ratios, where K+ is the potassium concentration and H2TA and H2MA are tartaric and malic acids, respectively.
Equation 1: pH = K+ / TA
Equation 2: pH = K+ / [H2TA]*[H2MA]
As seen in Equations 1 & 2, raising the K+ concentration while maintaining tartaric and malic acid levels will result in an increase in pH while maintaining TA.
The Washington State Conundrum
High pH with high TA is a relatively rare problem, but frustrating because of its seemingly paradoxical nature. Eastern WA, with its large temperature differentials, minimal rainfall, and young vineyards, has seen more than its share of this problem. The coupling of soils that may be high in K, with reduced degradation of malic acid, makes understanding how to manage a high pH, high TA vintage a must for every WA grower and winemaker.
In the Fall 2014 issue of VEEN, we will follow up on the “The Winemaker’s Conundrum” with a discussion of the techniques for managing acidity in the vineyard and winery.