VEEN is curated by WSU Viticulture Extension. For questions on articles, or to request to submit an article in future issues, reach out to Michelle Moyer.
This issue of VEEN was originally published as a .PDF in September 2014, and posted online. Some content here will differ from that original issue. The issue is archived, but accessible on the VEEN Archive webpage.
A Note from the Editor
It is hard to believe it is already September; even harder to believe that harvest has been underway for almost an entire month in some locations. With record crops this year in both wine and juice grapes, the season of harvest chaos will be with us until well into November.
The 2014 vintage has been a promising one for all of Washington’s wine regions. Record heat both east and west of the Cascades has moved vine development along rapidly, and the quick transition into fall, with our cool nights, and warm, sunny days will be offering Washington vintners the high Brix, high acid partnership our wines are known for.
We hope you enjoy this issue of VEEN; with articles ranging from an economic analysis of the importance of early intervention in trunk diseases, to an overview of how to conduct winery bench trials, this has been a fun and educational issue to develop.
P.S.: Part 2 of the “High pH, High TA: The Winemaker’s Conundrum”, will be in the Spring 2015 issue of VEEN.
Michelle M. Moyer
Viticulture Extension Specialist
Assistant Professor of Viticulture
WSU Prosser IAREC
Table of Contents
- Double Pruning to Prevent Trunk Diseases in Washington
- Native Plants and Beneficial Insects
- Blackleaf in Washington Concord Grapes
- Record Heat in 2014
- Bud Development and Fruit Formation in Grapevines
- Grape Leaffolders
- Winery Bench Trials
- Sensory Thresholds in Brettanomyces-faulted Wine
- Wine Microbiology Lab Update
Connect With Us
V&E Certificate Program
Double Pruning to Prevent Trunk Diseases in Washington
By Jonathan Kaplan, CSU-Sacramento, Renaud Travadon, UC-Davis, Kendra Baumgartner, USDA-ARS-Davis, CA
Trunk diseases (aka, wood-canker diseases) present a serious challenge to vineyard productivity and longevity. There are four main trunk diseases: Botryosphaeria dieback, Esca, Eutypa dieback, and Phomopsis dieback. The causal fungi (e.g., Eutypa lata, Neofusicoccum parvum) establish chronic infections of the cordons, spurs, and trunk. This results in stunted shoots, shoot dieback, and dead spurs, which are general symptoms for all trunk diseases. Often a single vine will have multiple wood cankers from different trunk pathogens. The cumulative yield losses, mainly from the dead spurs, build to the point at which management costs outweigh vineyard returns.
Symptoms can take 1 to 3 years to develop. Typically, disease incidence in the vineyard (i.e., the proportion of symptomatic vines) has to reach levels of 20% before a trunk disease problem becomes apparent. At this point, the only means of eradicating an infection is by physically cutting out infected wood and retraining a new trunk or cordon. Such post-infection practices are risky, however, because healthy-looking wood can harbor an infection.
The most effective practices are preventative, and in California include:
- Delay pruning until a period of low risk, or double prune.
- Treat pruning-wounds with a protectant (e.g., Topsin, Rally, Boron) before rain.
Double Pruning – A Brief Description
Pruning wounds made in early winter (November to December) are very susceptible to infection for two main reasons: 1) late fall / early winter rains induce spore release, and 2) cold temperatures lengthen the wound-healing process. In contrast, pruning wounds made in mid- to late winter (mid-March or later) are at lower risk of infection because rain is less frequent and wounds heal soon after pruning.
Double pruning is a type of delayed pruning for cordon-trained, spur-pruned vineyards and involves two passes:
- Pass 1 ( November to December) – Often with a mechanical pruning machine, canes are prepruned to about 10 to 12 inches above last year’s spurs. No cuts are made down to the cordon.
- Pass 2 (mid-March or later) – Long spurs are pruned back to desired spur length (i.e., 2-3 bud). This removes the section of the long spur cane that may have become infected through the pruning wounds made with Pass 1.
Adopting Trunk-Disease Prevention
While preventative practices have been shown to reduce pruning-wound infections in field trials, a recent survey in California by Baumgartner et al. [1] revealed that growers were hesitant to use them in newly-established vineyards, possibly due to uncertainties about cost-effectiveness and disease-control efficacy. Toward encouraging adoption of preventative practices, our economic analyses suggest that early adoption can significantly reduce the impacts of trunk diseases, generating returns nearly identical (~99%) to those from a healthy vineyard [2].
The same may be true for Washington State. To better understand the potential gains from early adoption of preventative practices we applied the methods used for California vineyards, focusing on double pruning for two main reasons. First, many growers already do a double pruning-like strategy, conducting a mechanical pruning pass sometime between November to January, with the second pass by hand in February to late March. The exact timing depends on the availability of labor and/or acreage to be covered. Second, while Topsin (thiophanate-methyl) is not approved as a pruning-wound protectant in Washington, Rally (myclobutanil) is. However, due to the lack of data on efficacy in Washington, this control strategy was not used in the presented management scenarios.
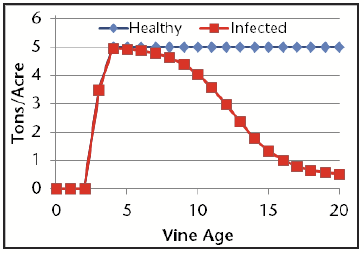
For the analysis, we simulated production of Cabernet Sauvignon, Chardonnay, Merlot, and White Riesling – the four leading wine grapes accounting for 75% of the total production in Washington. The effect of trunk diseases has not been evaluated in Washington State vineyards, and so we relied on data from California [3], which shows that by year 10, yield loss can be as large as 20% and by year 15 these losses can approach 70% (Fig. 1). Table 1 shows the yield-age assumptions for the four varieties.
| Year | Chardonnay | White Riesling | Cabernet Sauvignon and Merlot |
|---|---|---|---|
| Year 0-2 | 0 | 0 | 0 |
| Year 3 | 3.5 | 2.5 | 2.5 |
| Year 4 | 5 | 5 | 4 |
| Year 5+ | 5 | 7 | 4 |
Past field trials on double pruning have shown the practice to range in efficacy from as low as 28% for Esca to as high as 97% for Eutypa dieback (Table 2). Here efficacy was measured as the percentage of pruning wounds protected from infection (i.e., from which no trunk pathogens were recovered) in double-pruned vines (first pass in December, second pass in February) relative to vines that were pruned completely down to the spurs in December. Over time, we expect that double-pruned vines develop fewer pruning-wound infections and thus have less yield loss.
| Trunk Disease | Efficacy of Double Pruning |
|---|---|
| Botryosphaeria | 58 – 72% |
| Esca | 28 – 87% |
| Eutypa | 75 – 97% |
Methods
We used a simulated economic experiment framework, in which we constructed a representative bioeconomic model for wine grape production in an infected vineyard.
Table 3 lists the annual price per ton for wine grape varieties in Washington, and Table 4 provides the production cost per acre, assuming similar management costs across varieties. The baseline model simulates production from a healthy vineyard for a 20-year lifespan and subjects it to a trunk disease, assuming no preventative action is taken. We then simulated scenarios where double pruning, with varying efficacy, is adopted at different vineyard ages. We used pairwise comparisons between the baseline model and these scenarios to gauge the potential gains in net returns from adopting these practices, relative to no action or waiting until a vineyard has matured and symptoms of trunk diseases (and yield loss) are widespread.
| Variety | Price / Ton |
|---|---|
| Chardonnay | $961 |
| White Riesling | $796 |
| Merlot | $1,186 |
| Cabernet Sauvignon | $1,440 |
| Vineyard Age | Production Cost per Acre |
|---|---|
| Establishment and Year 1: Operating Cost | $9,028 |
| Year 2 Operating Cost | $3,143 |
| Year 3 Operating Costs | $3,709 |
| Year 4+ Operating Costs | $3,617 |
We considered 9 practice scenarios, which differ by disease control efficacy (25%, 50%, and 75%), and ages at which double pruning is adopted (year 3, year 5, and year 10). The range of net returns per acre per year averaged over a 20-year lifespan are depicted in Table 5 (infected vineyard is not double pruned; no action is taken). The cost of double pruning is assumed to be the same as pruning once in late February or March.
| Variety | Healthy: Net Return | Infected: Net Return | Difference: Healthy-Infected |
|---|---|---|---|
| Chardonnay | $3.20 | -$1,343.42 | $1,346.62 |
| White Riesling | $565.44 | -$1,072.04 | $1,637.48 |
| Merlot | $105.08 | -$1,289.70 | $1,394.78 |
| Cabernet Sauvignon | $821.36 | -$872.14 | $1,693.50 |
Results
Adoption of double pruning results in greater overall economic returns over a 20-year vineyard lifespan compared to doing nothing to combat trunk diseases. Table 6 shows these benefits for each of the varieties and scenarios. Further, the earlier in the vineyard lifespan one adopts the pruning practice in the vineyard, the better. The economic gains in terms of net returns from adopting the practice in year 3 or 5 are in many cases double that of waiting until the vineyard has matured (year 10). However, adoption of double pruning does not guarantee positive net returns. Those scenarios that are in bold in Table 6 represent scenarios where double pruning generates positive overall net returns over the entire vineyard lifespan. For infected Chardonnay, double pruning never produced positive overall net returns. Early adoption (year 3 or 5) in Merlot does not do much better unless we assume an efficacy level of 75%. White Riesling and Cabernet Sauvignon vineyards fare best, producing positive overall net returns when adopted in years 3 or 5, even with as low as 50% efficacy. Clearly, given the cost and revenue structure depicted in these scenarios, the best chance growers have is to adopt double pruning as early as possible.
| Scenarios: Timing of Double Pruning Adoption and Management Efficacy | Annual Gains: Chardonnay | Annual Gains: White Riesling | Annual Gains: Merlot | Annual Gains: Cabernet Sauvignon |
|---|---|---|---|---|
| year=3, 25% Efficacy | $525.88 | $567.60 | $544.70 | $589.36 |
| year=5, 25% Efficacy | $428.22 | $456.97 | $443.55 | $474.54 |
| year=10, 25% Efficacy | $184.64 | $180.63 | $191.25 | $188.20 |
| year=3, 50% Efficacy | $1,095.42 | $1,192.36 | $1,134.63 | $1,305.63 |
| year=5, 50% Efficacy | $960.48 | $1,104.52 | $994.88 | $1,143.95 |
| year=10, 50% Efficacy | $466.49 | $523.53 | $483.19 | $542.68 |
| year=3, 75% Efficacy | $1,304.95 | $1,515.15 | $1,351.65 | $1,569.13 |
| year=5, 75% Efficacy | $1,250.48 | $1,457.32 | $1,295.26 | $1,508.65 |
| year=10, 75% Efficacy | $805.28 | $935.69 | $834.11 | $968.75 |
Table 7 presents a look at how long a vineyard will provide positive net returns, based on a 20 year lifespan. Double pruning results in more years of positive annual net returns for all scenarios except for Chardonnay in year 10 with 25% efficacy. These greater years of profitable returns for Chardonnay are not large enough to compensate for the initial establishment costs. If however, growers adopt double pruning in years 3 or 5, they can extend the profitable lifespan in a mature vineyard by as much as 100%. In the case of White Riesling, Merlot, and Cabernet Sauvignon, this extended lifespan translates into a greater ability to generate positive overall net returns over the 20 years.
| Scenarios: Timing of Double Pruning Adoption and Management Efficacy | Last Year of Positive Returns: Chardonnay | Last Year of Positive Returns: White Riesling | Last Year of Positive Returns: Merlot | Last Year of Positive Returns: Cabernet Sauvignon |
|---|---|---|---|---|
| No Action | 10 | 11 | 10 | 11 |
| year=3, 25% Efficacy | 12 | 14 | 13 | 14 |
| year=5, 25% Efficacy | 12 | 14 | 12 | 14 |
| year=10, 25% Efficacy | 10 | 12 | 11 | 12 |
| year=3, 50% Efficacy | 18 | 20 | 19 | 20 |
| year=5, 50% Efficacy | 16 | 19 | 17 | 19 |
| year=10, 50% Efficacy | 11 | 14 | 12 | 14 |
| year=3, 75% Efficacy | 20 | 20 | 20 | 20 |
| year=5, 75% Efficacy | 20 | 20 | 20 | 20 |
| year=10, 75% Efficacy | 13 | 19 | 15 | 19 |
Conclusion
Although Washington State wine grape production differs from that in California, we were able to apply similar methods to the situation in Washington State that were used in Baumgartner et al. [2] to illustrate the gains to wine grape growers who adopt double pruning early in a vineyard’s lifespan. Only by adopting early can growers offset the negative effects of trunk diseases. In the future, greater effort is likely needed to inform growers of the benefits of early adoption of double pruning. In addition, more research on other practices will aid growers when they decide how to manage their vineyards.
References
- Baumgartner K., et al. 2013. Trends in usage and grower perceptions of preventative practices for management of grapevine trunk diseases. Research Briefs. (posted 12/16/13)
- Baumgartner K., et al. 2014. An economic case for early adoption of practices to prevent and manage grapevine trunk diseases. Research Briefs. (posted 1/16/14)
- Munkvold, G.P, Duthie, J.A. and J.J. Marios. 1994. Reductions in yield and vegatative growth of grapevines due to Eutypa dieback. Phytopathology 84:186-192
- Larignon, P., and B. Dubos. 2000. Preliminary studies on the biology of Phaeoacremonium. Phytopathologia Mediterranea. 39:184-189.
- Úrbez-Torres, J.R. and W.D. Gubler. 2011. Susceptibility of grapevine pruning wounds to infection by Lasiodiplodia theobromae and Neofusicoccum parvum.” Plant Pathology 60:261–270.
- Weber, E.A., Trouillas, F.P. and W.D. Gubler. 2007. Double pruning of grapevines: A cultural practice to reduce infections by Eutypa lata. Amer. J. Enol. Vitic.. 58:61-66.
- NASS. 2014. WA Wine Grape Release – 2013. USDA. (posted 3/2/2014).
- Folwell, R.J. et al. 1997. Production and marketing risks associated with wine grapes in Washington. WSU Extension Publication XB1035e.
- Ball, T. and R.J. Folwell. 2003. Wine grape establishment and production costs in Washington. WSU Extension Publication EB1955. Out of print.
- Ball, T. and R.J. Folwell. 2014. Northwest Grapes Cost of Production Calculators. Washington Association of Wine Grape Growers.
Native Plants and Beneficial Insects
By Katie Buckley, Graduate Student, WSU Prosser
For the past four seasons, entomologists at WSU-IAREC in Prosser, WA have been evaluating the potential use of native plants to provide biological control of pest insects in vineyards. Maintaining areas with native plants that attract and enhance populations of predators, parasitoids and pollinators should improve the efficacy of biological pest control. These studies included monitoring the influence of restored native habitats on beneficial insect populations, in addition to specifically monitoring the ability of different native plant species to attract insects.
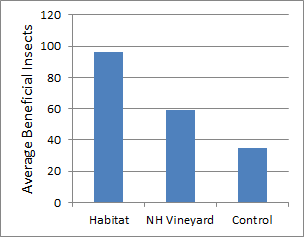
To determine whether native plant restoration influences the abundance of beneficial insects in commercial vineyard settings, three seasons of data on pest and beneficial insect populations were collected from both vineyards with restored native habitat and vineyards with conventional floor covering at four separate locations. Results from this data showed that vineyards with restored native habitats had a more diverse population of beneficial insects (Fig. 1).
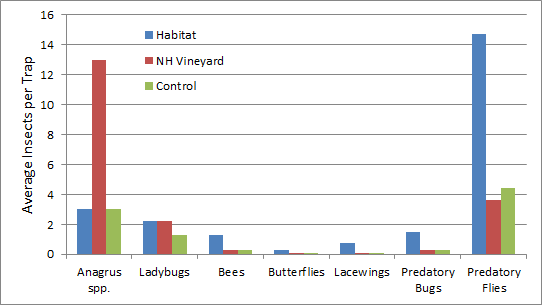
Anagrus wasps, which parasitize leafhopper eggs, were over 4X more abundant in habitat restored vineyards than conventional vineyards. Ladybeetles were consistently more frequent in habitat restored vineyards than conventional vineyards. Many beneficial insects were much higher in restored habitat than in vineyards, including native bees, butterflies, lacewings and predatory bugs and flies (Fig. 2). This is expected as more diverse plant communities draw in more diverse insect communities.
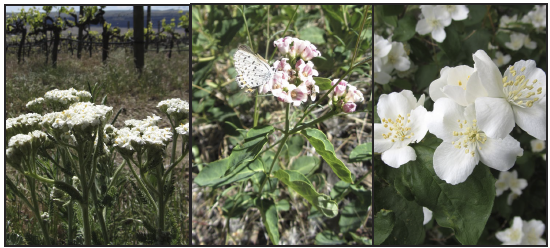
A study looking at the ability of specific native plant species to attract beneficial insects has yielded interesting results. After 4 years of data collection from over 5000 sticky-traps across multiple locations throughout central eastern Washington, a system to rank the effectiveness of 100 native plant species on insect attraction has been developed. The top beneficial-insect (including Anagrus wasps) attracting plant is sagebrush (Artemisia tridentata) in both diversity and total number of beneficials. Other high ranking plants for both total number and diversity of beneficial insects include: Yarrow (Achillea millefolium, Fig. 3), Pink Dogbane (Apocynum androsaemifolium, Fig. 3), Showy Milkweed (Asclepias speciosa), Green Rabbitbrush (Chrysothamnus viscidiflorus), Gray Rabbitbrush (Ericameria nauseosa), Tall Buckwheat (Eriogonum elatum), Oceanspray (Holodiscus discolor), and Mock Orange (Philadelphus lewisii, Fig. 3).
This research was possible from the support of the Washington wine grape industry, Western Sustainable Agriculture, Research and Education (WSARE), the Northwest Center for Small Fruits Research (NCSFR) and participating growers.
Blackleaf in Washington Concord Grapes
By Michelle Moyer, WSU Prosser
The summer of 2014 was exceptionally hot and sunny. Given these conditions, it is no wonder reports of Concord Blackleaf have been rolling in faster than a lower valley dust storm (Fig. 1). In some cases, blackleaf has not been limited to juice grapes, there have also been reports of it on some wine grapes in select locations.
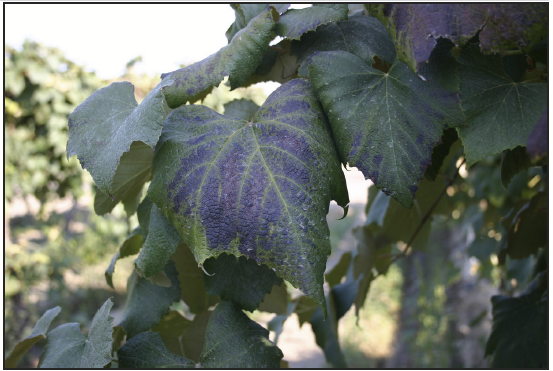
in the late summer. Photo by Michelle Moyer.
In order to understand how to potentially manage or prevent blackleaf, we have to understand what it is and what it is not. It is not a nutritional deficiency. All of those old recommendations for apply potassium fertilizer to alleviate symptoms? Throw them out. It is not a result of mite feeding. Mites will cause a more browning and bronzing of leaves; and they can be controlled with a miticide. Spraying a miticide will not alleviate blackleaf. It is not a disease; not powdery mildew, not Grapevine leafroll.
It is a physiological disorder which results in the degradation of chloroplasts (the structures that conduct photosynthesis), and death of epidermal cells (the outer “skin” of a grape leaf). This degradation and death is caused by exposure to excessive UVB sunlight. Specifically, in blackleaf, the damage is a result of exposure to UVB when the leaves are not fully mature and therefore lack the waxy cuticle and build-up of sunscreen compounds that would naturally protect the tissue from damage.
In Washington, most of the damage that is seen in Concord vineyards as “black leaves” in September, was actually from damage that was initiated in late June and early July. This is why blackleaf tends to be a bigger problem during years with reduced cloud coverage during those months. The damage takes time to fully manifest itself and display the “black leaf” symptoms. It is akin to the delayed muscle pain felt when starting a new sport or exercise regime.
Why do some Concord blocks display severe symptoms of blackleaf when adjacent blocks have very little? Drought stress has been implicated in exacerbating blackleaf in Concord. Drought stress reduces vine transpiration, which in turn, can result in superheating of leaf tissue exposed to the sun. This high heat exposure can further damage chloroplasts and cells, accelerating the damage to the leaf tissue. As such, vineyards that experienced water stress do risk having more severe blackleaf symptoms. Water stress only enhances symptom development in vineyards that have already suffered from blackleaf damage, it does not cause it.
There are no current commercially-acceptable techniques for preventing blackleaf in Concord vineyards. However, in years with few cloudless days and warm temperatures, the severity of blackleaf may be reduced with appropriate management of vine water stress.
For more information on blackleaf and potential ways to reduce symptoms, please see WSU Extension Publication EB0745, Blackleaf in Grapes (Olmstead et al. 2005).
Record Heat in 2014
By Nic Loyd and Gerrit Hoogenboom, AgWeatherNet, WSU Prosser
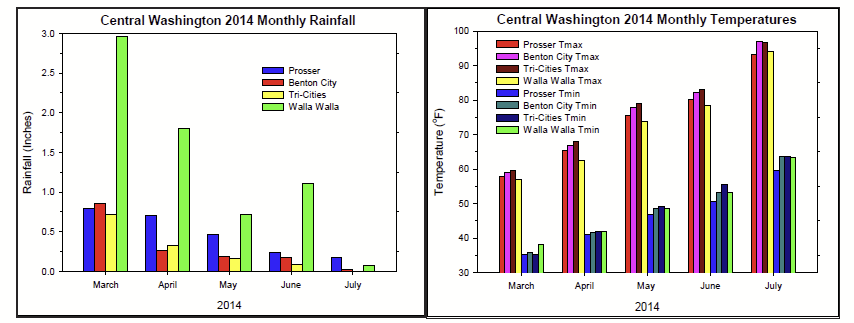
If you thought that 2014 has been hot, you are right. Sizzling temperatures have dominated the weather for much of the season. Following the warmest spring season since 1994, the summer of 2014 at Prosser, WA is on pace to be the hottest since AgWeatherNet records began a quarter of a century ago.
One hallmark of the 2014 growing season has been the consistent above-normal temperatures in central and eastern Washington. August was the sixth consecutive month of warmer than normal temperatures. Rather than a few episodes of extreme heat, this year provided a notable abundance of warmer-than-normal days and nights. This pattern was particularly evident in July, which was the warmest month on record at Prosser and many other climate sites around central Washington. The mean high temperature in July, 93.2˚F, surpassed the previous record of 92.1˚F, set in 2013. It was nearly 5 degrees above normal. The 2014 Accumulated Growing Degree Day (April 1 to September 1) value at Tri-Cities was 2962 units, which is 395 units above the recent average (Table 1).
| LOCATION (STATION) | 2014: Growing Degree Days (Base 50, 1 April-1 Sept) | Recent Average: GDD (Base 50, 1 April-1 Sept) | GDD Difference: 2014 and Recent Average |
|---|---|---|---|
| Prosser (WSU HQ) | 2193 | 1853 | 340 |
| Tri-Cities (WSU TC) | 2627 | 2243 | 384 |
| Walla Walla (Walla Walla) | 2282 | 1953 | 329 |
| Benton City (Benton City) | 2526 | 2145 | 381 |
The Tri-Cities recorded +100˚F temperatures on 10 days during July, which included one day (July 16) at 109˚F. The heat has not been limited to the daytime. Wahluke Slope observed several sultry nights, including a low of 84˚F on July 13, along with low temperatures above 70˚F on a majority of July mornings (18 total). Still, the abnormal warmth was not relegated exclusively to July. May was also a noteworthy month in which Prosser experienced the warmest mean May high since 1993. More recently, the Tri-Cities recorded 5, +100˚F days during the early part of August alone. The month of August and the summer season (June to August) were Prosser’s warmest on record. In fact, the last time any season was so warm relative to normal was the winter of 2002/2003.
Unfortunately, the blistering weather was not without consequences, as our state suffered through its largest wildfire on record. It is hard to remember that the spring season began with most of central Washington experiencing sub-30˚F high temperatures during a rare, late winter arctic intrusion on March 2. The cool blast was followed by an active and wet period during which Montesano received nearly 8 inches of rainfall in one week (March 2 to 8). Other highlights of the period include 0.41 inches of rain at Walla Walla on June 18, and a 50 mph wind gust at FishHook on July 23.
Overall, the Tri-Cities had accumulated a net water deficit (precipitation minus evapotranspiration) of about 48 inches from March 1 through the end of August. Meanwhile, Prosser’s mean temperature was about 2.8˚F above normal for the May to July period, including 3.4˚F warmer than normal during the day. For better or worse, with the prospect of a developing El Niño, unusually warm conditions may be with us for some time to come.
Further details about Washington’s weather and climate are available at AgWeatherNet.
Bud Development and Fruit Formation in Grapevines
By Hemant Gohil, Technology Transfer Specialist, WSU Prosser
In grapevines, the current season’s crop begins to form in the spring of the previous year. This article is a brief review of the stages of bud development that encompasses fruit formation over two years, and how cultural practices and environmental factors enhance or detract from fruit formation, and thus, influence yield potential in the vineyard.
Fruit Formation
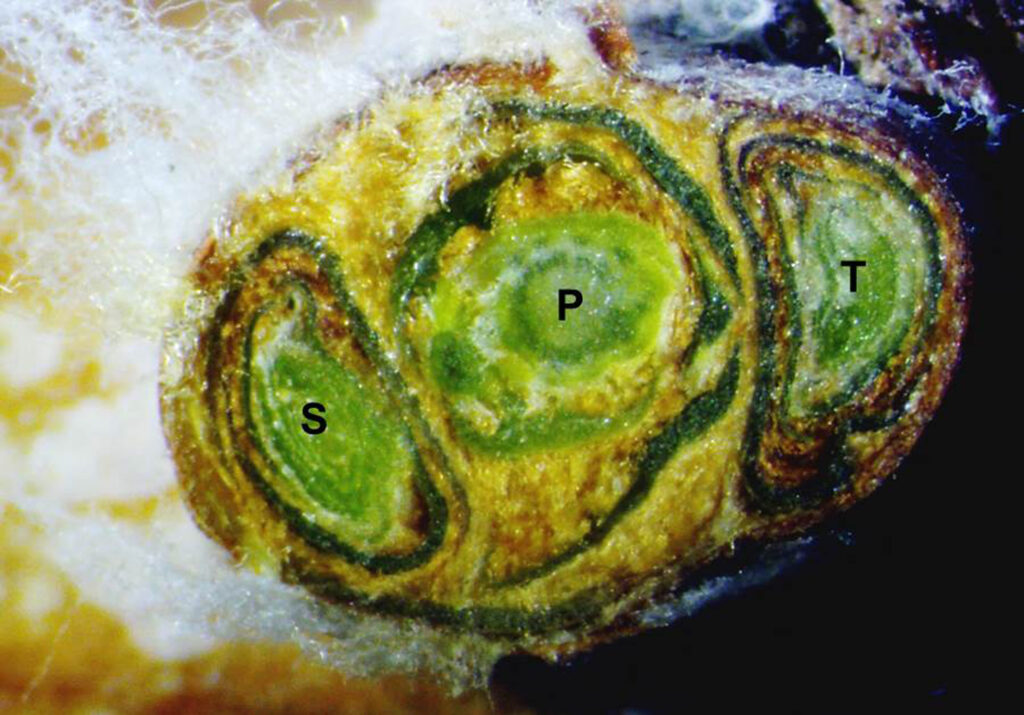
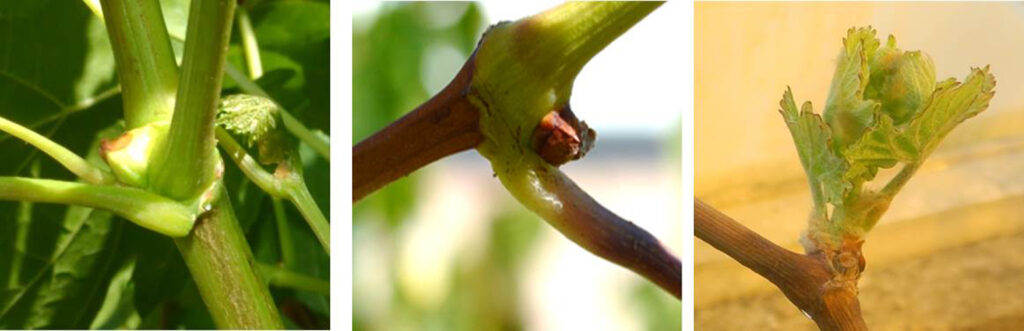
Grapevine buds develop at the base of leaf petioles on the shoot during the growing season. These buds are actually comprised of a primary, a secondary and a tertiary bud (Fig. 1). A small shoot develops inside the primary bud, typically containing 10 to 12 leaf primordia and one to three inflorescence (cluster) primordia (organs in their earlier stage of development) [1]. Small shoots also develop inside the secondary and tertiary bud, and the secondary bud has fewer inflorescence primorida. The tertiary bud is almost entirely vegetative. These differences in inflorescence primodria development influences the following year’s vine fruitfulness. During year 1, the primary bud inside of the compound bud will typically not develop into a shoot as long as the main shoot is green and actively growing [2]. As the main shoot matures, the compound bud development is complete (Fig. 2). The compound bud then acclimates to cold hardiness.
In the spring of year 2 just before the bud starts to swell, when soil and ambient air temperatures begins to warm, the differentiation (development) of flowers on the inflorescence primordium begins. As the bud breaks, the primary bud is the one that typically develops into a shoot (Fig. 2). However, if the primary bud is damaged, the secondary or tertiary bud may break. After bud break, but before the shoot begins rapid expansion, the inflorescence primordia begin the process of developing branches and flower initials. This process is what will determine the number of potential flowers per cluster [2]. The subsequent development of individual flower organs takes place over five weeks during and after bud break.
Factors Influencing Fruitfulness
During year 1 of the bud development, there are several factors that can affect the number of inflorescence primordia [2]. Depending on the region and variety, temperatures between 75 to 90ºF for three weeks in early summer of year 1 (typically around bloom of the clusters on the mother shoot), promotes the formation of inflorescence primordia in the developing bud; temperatures less than 75ºF favors the development of tendril primordia. Temperatures greater than >95ºF may result in no inflorescence or tendril primordia [3]. A dense canopy during this time means poor light penetration which may result in fewer inflorescence primordia as well as reduced carbohydrate assimilates for the developing buds [4, 5]. Total leaf area impacts how much photosynthesic products are synthesized and transferred to developing bud; disease and pest infection or hail damage can reduce the leaf area, resulting in reduced bud fruitfulness. Severe water deficit during bud development is detrimental, however moderate water stress may maximizes cluster differentiation and potential fruitfulness by improving canopy microclimate and thus light exposure to the developing bud [1,2,6]. Appropriate application of nitrogen at during bloom in year 1 can increase the number of inflorescence primordia in developing buds, however over-fertilizing can result in dense canopy, lowering bud fruitfulness due to lack of sunlight and heat exposure of developing buds [2, 4]. In regions with cooler springs and summers, buds that develop later in the season, during periods of increased sun-exposure and warmer temperatures, tend to have higher fruitfulness than those basal buds that developed during cooler, cloudier conditions.
In year 2, higher temperature (>95ºF) during and after the bud break negatively affects the number of flowers per inflorescence; however higher temperatures and warmer soil during spring accelerates shoot growth as well as flower development as the rate of nutrient mobilization increase [2]. Too dry soil before and during the bud break could cause cluster inflorescence abortion in the early stage of development. Other factors responsible for limiting the nutrient reserve and its mobilization and thus reduced flower formation are a dense canopy, poor nutrition management, a dry soil profile during the spring, and reduced leaf area due to insect or pest damage as described above.
Pruning Strategies
In climates where winter freezes are common, growers should assess bud viability prior to pruning. WSU publication Assessing and Managing Cold Damage in Washington Vineyards [7] discusses how to dissect a bud to determine whether it is alive or dead, and how to adjust pruning strategies based on crop potential. Additionally, in cool-climate regions, cane pruning may be preferred over spur pruning. Due to the influence of temperature on cluster and/or tendril formation in buds, cane pruning may be necessary in cooler climates to retain buds that developed later in the growing season during warmer conditions (i.e., buds that are distal from the cane base). Cane pruning may also be necessary when growing varieties with known low “basal bud fruitfulness”. In regions with warm springs and summers, the retention of later-formed buds that is achieved with cane pruning is not necessary, and spur pruning is acceptable. This is because environmental conditions favoring inflorescence primordia formation were achieved earlier in the growing season, during a time when basal buds were developing on the growing shoots.
Conclusion
Many factors influence the formation of inflorescence primordia in buds, ultimately influencing vine fruitfulness. From canopy management to water and nutrient management, viticultural practices can enhance or detract from this fruit formation. Understanding how your practices may influence fruit formation will allow you to manipulate these factors to achieve your yield goals.
References
- Williams, L.E. 2000. Bud development and fruitfulness of grapevines. In: Raisin Production Manual. UC-ANR Publication 3393.
- Keller, M. 2010. The Science of Grapevines: Anatomy and Physiology. Academic Press, Burlington.
- Buttrose, M.S. 1970. Fruitfulness in grapevine: Development of leaf primordia in relation to bud fruitfulness. Botanical Gazette 131:78-83.
- Keller, M. and Kolbert, W. 1995. Dry matter and leaf area partitioning, bud fertility and second-season growth of Vitis vinifera L. Response to nitrogen supply and limiting irradiance. Vitis 34:77-83.
- Dokoozlian, N.K. and Kliewer, W.M. 1995. The light environment within grapevine canopies. I. Description and seasonal change during fruit development. Am. J. Enol. Vitic. 46: 209-218.
- Keller, M. 2005. Deficit irrigation and vine mineral nutrition. Am. J. Enol. Vitic. 56: 267-283.
- Moyer, M., et al. 2011. Assessing and managing cold damage in Washington vineyards. WSU Extension Publication EM042E.
Grape Leaffolders
By Michelle Moyer, WSU Prosser
The grape leaffolder (estimated Desmia funeralis) is an isolated grape pest in Washington vineyards. The adult is a small, black moth with white spots. The larvae of this moth are what cause the namesake damage in the vineyard.
The insect overwinters as a pupa, and when adult moths emerge in the spring, they lay eggs on the grape leaf surface (upper and lower). The hatching larvae feed on leaf tissue, and then roll tissue (Fig. 1) in order to create an enclosure in which to pupate. In warmer climates such as California, there are up to 3 generations of leaffolders as season. The number of generations in Washington is unknown, but is likely around 1-2 generations, depending on weather conditions.
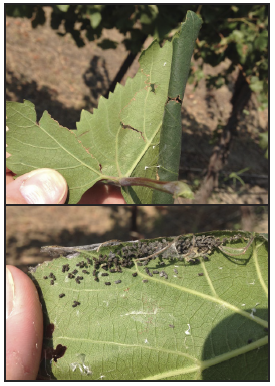
This feeding on and rolling of grape tissue can reduce vine vigor; however, it rarely causes substantial problems if done during the late summer / early fall well after bloom. The UC-Davis IPM Program reports that most wine grape vineyards can handle up to 20% leaf-rolling at fruit set, and more later in the season. Management intervention is rarely recommended in wine grapes unless the leaf-folding is wide-spread, severe, and early in the growing season.
Due to the low incidence of leaffolder in Washington, monitor past-affected vineyard blocks for potential outbreaks.Spray at the first signs of folding in blocks where outbreaks have been severe in the past.
If leaffolder damage is widespread and problematic in your vineyard, products such as spinosad (e.g., Entrust) and spinotram (e.g., Delegate WG) are labeled for grape leaffolder control. Please consult the label for rates and other application information.
Winery Bench Trials
By Richard Larsen, Research Winemaker, and Jim Harbertson, WSU Prosser
Proper use of fining agents in winemaking can be tricky. Not using enough fining agent can result in wasted additions without achieving your fining goals. Too much fining agent can strip the wine of desired properties. Determining what is just right in terms of fining additions can be done with a simple bench trial.
Setting up a wine fining agent bench trial is not as daunting as it may appear. It is convenient to use 100 mL graduated cylinders for bench trials because of the simplicity of metric calculations that can be done in factors of 10. Once the final concentration of the fining agent has been selected from the bench trial results, it is then simple to convert the required amount back into the English system if desired.
Fining for Bitterness Removal.
Polyvinylpyrrolidone, or PVPP, can be used to treat a white wine to reduce phenolic bitterness and oxidative browning. The typical additions range from 4 to 10 lbs per 1000 gal, which is equivalent to 476 to 1195 mg/L. In this case, we will use one control wine and evaluate four different treatment concentrations of PVPP. The stock solution of PVPP will be 100 g/L (or 10 g/100 mL; 100,000 mg/L or 100,000 ppm). Add 10 g of PVPP to 90 mL of water in a beaker, and stir for an hour or more to allow the PVPP to fully expand. Add additional water if necessary to bring the total volume to 100 mL. PVPP is not soluble in water but the particles will swell. Fill five, 100-mL graduated cylinders with 90 mL of wine. While keeping the PVPP solution well mixed, add the volumes of solution indicated in Table 1 to these different wine samples using a micropipette. Add additional wine to each sample to bring the final volume to 100 mL. Seal the cylinders and mix well by inverting several times over a 30-minute period. Allow the PVPP to settle out and then perform sensory analysis on the treatments. Select the treatment that resulted in your desired bitterness reduction.
| PVPP Treatment | Stock Solution to add to 100 mL wine sample | Final grams or ounces to add to 1 gal wine | Final grams or ounces to add to 100 gal wine |
|---|---|---|---|
| Control | 0 mL | 0 | 0 |
| 200 mg/L | 0.2 mL | 0.76 g / 0.0268 oz | 76 g / 2.68 oz |
| 400 mg/L | 0.4 mL | 1.52 g / 0.0536 oz | 152 g / 5.36 oz |
| 600 mg/L | 0.6 mL | 2.28 g / 0.0804 oz | 228 g / 8.04 oz |
| 800 mg/L | 0.8 ml | 3.04 g / 0.1072 oz | 304 g / 10.72 oz |
Fining for Sulfur Compound Removal.
If you have a stinky wine that you suspect may be caused by sulfur compounds, the use of copper sulfate may be required. Copper at high levels is toxic and the quantity of copper that can be added to wine cannot exceed 6 ppm (mg/L) and the residual level of copper in the finished wine cannot exceed 0.5 ppm (27 CFR Chapter I, Subchapter A, Subpart L, Section 24.246, Alcohol and Tobacco Tax and Trade Bureau). To avoid exceeding the 0.5 ppm limit, add no more than that amount in a bench trial, or to the wines in the winery. In order to accurately determine copper levels using copper sulfate, the elemental copper needs to first be calculated from the chemical formula CuSO4•5H2O. In this case, there is 250 mg copper in 1 g of copper sulfate. Hence, 1 g of CuSO4•5H2O in 1 L of water would consist of 250 ppm copper. For convenience, our stock solution will contain 1 g of copper sulfate dissolved in 250 mL of water for a concentration of 1000 ppm. In order to bring the concentration down to workable levels, a 1:10 dilution is made using a 100 mL cylinder. That is, 10 mL of the 1000 ppm solution is added to 90 mL of water to make a final concentration of 100 ppm. Using the above formula, the amount of stock solution is calculated for each treatment (see Table 2). Allow the copper sulfate to stand 3 to 4 hours or overnight before conducting sensory analysis.
| Copper Sulfate Treatment | 100 ppm solution to add to 100 mL wine sample | Amount of 100 ppm solution to add to 1 gal wine | Amount of 100 ppm solution to add to 100 gal wine |
|---|---|---|---|
| Control | 0 mL | 0 mL | 0 mL |
| 0.2ppm | 0.2 mL | 7.6 mL | 760 mL |
| 0.3 ppm | 0.3 mL | 11.4 mL | 1140 mL |
| 0.4 ppm | 0.4 mL | 15.2 mL | 1520 mL |
| 0.5 ppm | 0.5 mL | 19.0 mL | 1900 mL |
Fining for Wine Clarity
There are many products on the market that promise the ability to clarify wine. Since there are so many potential products to try, we are presenting a generic example where the package label indicates an addition of 15 oz. per 100 gallons. However, check the maximum limit of the agent in wine allowed by law prior to adding (Section 24.246; http://ttb.gov/wine). For this example we will state that the website indicates that the maximum allowable rate is 25 oz. per 100 gal. Convert the recommended and maximum rates into metric values: 15 oz. x 28.35 g/oz. = 425.3 g. Then convert 100 gallons to liters: 100 gal x 3.8 L/gal = 380 L. Hence, the recommended rate would be 425.3 g / 380 L = 1.12 g/L. Following the same procedure, the calculated maximum rate is 1.87 g/L. Choosing four different rates divided equally from a selected minimum of 0.75 g/L to the maximum of 1.87 g/L, we will add 30 g to 250 mL water final volume to make a stock solution of 120 g/L (see Table 3). Keep in mind that at this concentration, the agent may not all go into solution due to solubility, so a less concentrated solution may be necessary. After the agent is fully dissolved, the amounts shown in the table are added to the 100 mL cylinders. Following the manufacturer recommendations, the treated wines are evaluated after the prescribed treatment times have passed.
| Clarifying Treatment | 120 g/L solution to add to 100 mL wine sample | Final grams or ounces to add to 1 gal wine | Final grams or ounces to add to 100 gal wine |
|---|---|---|---|
| Control | 0 mL | 0 | 0 |
| 0.75 g/L | 0.63 mL | 2.85 g / 0.10 oz | 285 g / 10.0 oz |
| 1.12 g/L | 0.93 mL | 4.26 g / 0.15 oz | 426 g / 15.0 oz |
| 1.50 g/L | 1.25 mL | 5.70 g / 0.20 oz | 570 g / 20.0 oz |
| 1.87 g/L | 1.56 mL | 7.11 g / 0.25 oz | 711 g / 25.0 oz |
Conclusion
Following the bench trial examples shown here, any available fining agent can be set up in a similar fashion. It is important to note that a given fining agent may not always completely resolve the issues being confronted in the wines. For example, after treatment with copper sulfate, the wine may be free of hydrogen sulfide but may still contain some sulfur-derived off-odor attributes, indicating that there are likely other, more complex sulfur compounds in the wine such as disulfides that cannot be resolved by fining with copper sulfate. In many cases, more than one fining agent may be required to treat a wine, so some trial and error with these agents should be expected in order to achieve the desired results. For example, there are commercially available fining agents such as yeast hulls that may be useful for removing some sulfur compounds but as mentioned earlier, there is little published evidence as to their efficacy.
In addition, while fining agents may be successful for removing a specific undesired compound(s) from the wine, it is possible that they may remove some of the positive attributes in the wine. Hence, it is always prudent to use the lowest concentration of fining agent that is possible to achieve the end goal for the wine. Alternatively, if too many of the desired attributes are being stripped from the wine, a different fining agent should be considered.
After fining agents have been added to a wine, many of them, such as PVPP, will require filtering prior to bottling. This requirement not only results in some loss of wine, but it may additionally strip wine of some its desirable sensory traits, so this will also need to be considered in the fining process.
Fining Agents: Selection Considerations
- Which agent(s) do what you would like done?
- What are the legally-defined must or wine addition limits?
- Is the agent soluble in juice or wine, or will agitation be necessary?
- What is the temperature you plan on using for the fining trial? It should be the same temperature as the final wine as many chemical reactions in juice and wine are dependent on temperature.
Fining Agents: Stock Solutions
Because of the minute quantities of fining agents used in bench trials, concentrated stock solutions are often prepared. To make a dilution, the following formula is used:
V1C1 = V2C2
V1 = Volume of the stock solution. C1 = Concentration of the stock solution.
V2 = Volume of diluted solution. C2 = Concentration of the diluted solution.
To make things easy, below equation has been solved to determine how much stock solution of a fining agent is needed for wine additions:
Stock Solution (Fining Agent) = [(Final Wine Volume) X (Final Fining Agent Concentration)] / (Stock Solution Concentration)
Sensory Thresholds in Brettanomyces-faulted Wine
By Charles Diako, Graduate Student, and Carolyn Ross, WSU Pullman
When the wild yeast Brettanomyces grows in wine, it produces several compounds that can alter the sensory properties of a wine. At low levels, some winemakers feel that these compounds exert a positive effect on wine. However, at high concentrations, these Brettanomyces-related compounds generally exert a negative effect.
While several of these Brettanomyces-related compounds have received research attention to determine aroma thresholds, 4-ethyl catechol (4-EC) has received less attention. Interestingly, metabolic precursors to 4-EC (caffeic acid) are in much higher amounts compared to the precursors for other Brettanomyces-related compounds in Washington wines [1].
As such, our lab set out to determined the sensory impact of 4-EC (ethyl catechol) in red wine and the ability of the e-tongue to distinguish samples containing different concentrations of 4-EC. In this exploration of 4-EC, both detection thresholds and consumer panels were used. Detection threshold values indicate the concentration needed for a difference to be detected in a wine (DT = detection threshold), and consumer panels evaluate the preference or liking of a particular sample by consumers. This value was expressed as the consumer rejection threshold (CRT).
Different concentrations of 4-EC (493, 714, 1035 and 1500 μg/L) were added to a Washington Merlot wine. Using sensory evaluation panels, both the consumer detection threshold (DT) and the consumer rejection threshold (CRT) of 4-EC were determined.
Detection threshold for ortho-nasal olfaction (smell) was determined using the forced-choice ascending concentration series triangle test, where a panelist indicated the sample that he/she identified as different from the other two.
Consumer preference for the 4-EC in wine samples was determined using a four paired comparison tests, one for each concentration of 4-EC. Each pair consisted of a control sample (base wine with no added 4-EC) and a sample of the base wine containing 4-EC. Consumers were required to taste both samples and indicate which sample of the pair was preferred. The proportion of consumers preferring the control sample was plotted against 4-EC concentration.
Each of the wines samples (n=5 samples) containing the 4-EC, along with a base wine were analyzed using the e-tongue. Taste attributes of wine samples (sourness, sweetness, umami, metallic, bitterness and spiciness) were analyzed using the Astree II electronic tongue unit (Alpha MOS) equipped with a liquid auto sampler. The e-tongue data were analyzed and compared with the results from the sensory evaluation.
The threshold value of 4-EC in the Washington Merlot was determined to be 823 µg/L using the untrained, but experienced, red wine consumers (Fig. 1). This threshold compares to a previously reported value of 774 μg 4-EC/L, in Cabernet Sauvignon [2]. A lower value of 442 μg 4-EC/L was reported in Pinotage [3]. The literature values reflect the significant impact of wine matrix on the threshold and detection of 4-EC.
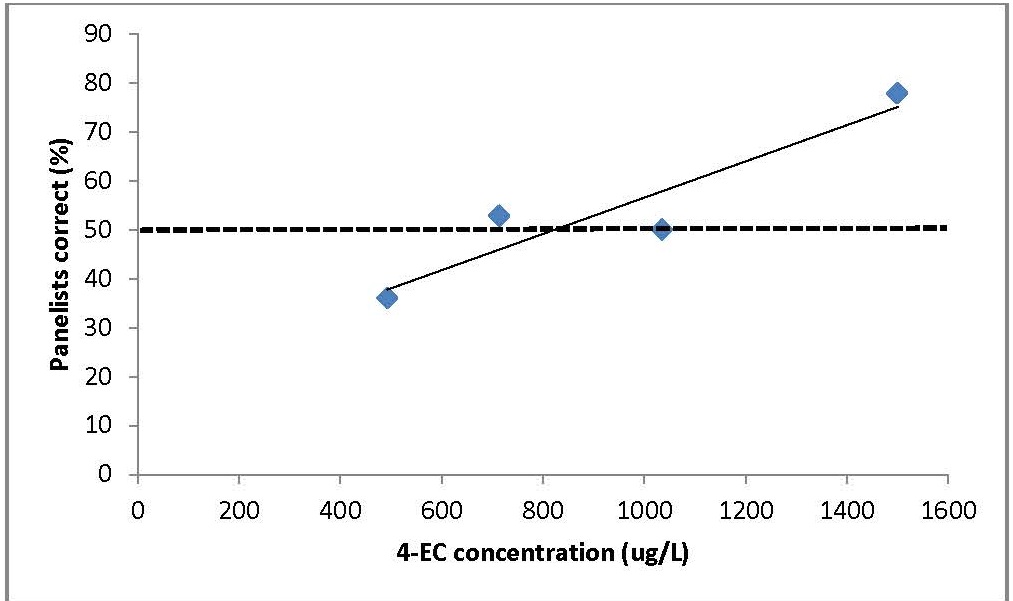
There was no difference in consumer preference between the control wine (no 4-EC) and the wine containing the highest concentration of 4-EC (1500 µg/L). The lack of significant results in preference may be due to the low number of consumers used in the study, differences among consumers in sensitivity to 4-EC or differences among consumers in their acceptance of 4-EC in wine.
If consumers were able to detect the 4-EC, differences in preference may also be due to the change in the sensory properties of the wine with this increased 4-EC concentration. In Pinotage, as 4-EC concentration increased up to 1193 μg/L, the wines were increasingly described with savory descriptors and less with berry-like descriptors [3]. We did not examine the specific changes in the wines; however, a similar phenomenon may be occurring in the Merlot. With added 4-EC, the wines changed in their sensory profiles, with these changes affecting consumers differently depending on their preferences.
Results showed that the electronic tongue was able to discriminate (DI = 82%) among the wine samples with 4-EC (Fig. 2). The lowest concentration distinguished by the e-tongue was 493 μg/L, which was lower than the sensory threshold determined in this study. High concentrations of 4-EC were associated with low response of the e-tongue to the different attributes. The reference sample was defined as being higher in the attributes assessed by the e-tongue, including sweetness and sourness.
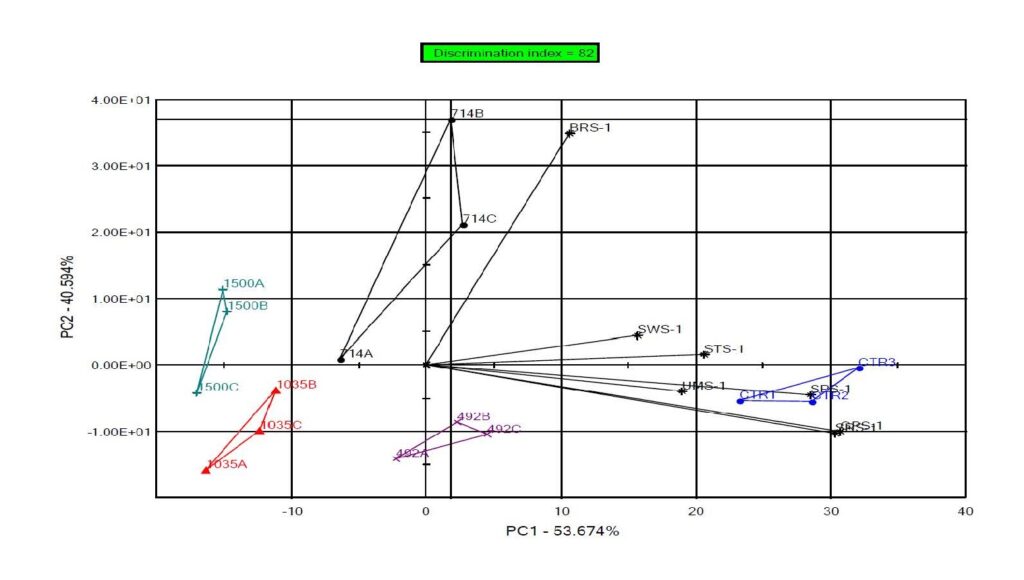
Considering the electronic tongue and sensory findings, the results suggest that for the detection of 4-EC in Merlot wine, the e-tongue may be more sensitive than many consumers. This finding is of great interest as it shows the e-tongue as a promising method for the detection of sub-threshold concentrations of compounds contributing to faulted wines, perhaps leading to early detection of these flaws.
References
- Schopp, L.M., et al. 2014. Metabolism of nonesterified and esterified hydroxycinnamic acids in red wines by Brettanomyces bruxellensis. J. Agric. Food Chem. On-line publication.
- Curtin, C., et al. 2008. Sensory perceptions of Brett relationship to consumer preference. In Proc. 13th Australian Wine Ind. Tech. Con. July 2007, Adelaide, SA; 207-211.
- Botha, J. 2010. Sensory, chemical and consumer analysis of Brettanomyces spoilage in South African wines. Thesis: Stellenbosch University.
Wine Microbiology Lab Update
By Charlie Edwards, WSU Pullman
Pullman continues to focus on two primary issues: (a) wine spoilage by Brettanomyces; and (b) the potential use of certain species of non-Saccharomyces yeasts to alter wine quality.
Metabolism of phenolic compounds by Brettanomyces. Studies related to the ability of Brettanomyces. to metabolize phenolic compounds in wine grapes demonstrated that Brettanomyces. are not able to metabolize tartaric acid esters of phenolic acids present in red wines. In addition, these studies also showed that the presence of Brettanomyces. does not always mean that the contamination will result in the production of 4-ethylphenol / 4-ethylguaiacol, or the characteristic barnyard / medicinal aroma. Finally, the studies also demonstrated that the specific strain of Brettanomyces, not the wine substrate, influenced the growth and metabolism of this spoilage yeast.
Impact of ethanol and storage temperature on Brettanomyces growth. The different strains of Brettanomyces studied all grew well in wines containing 12% to 14% ethanol when wine temperature was greater than 59°F. The ability of these strains to survive decreased when wines were stored at 53.6°F, or when the wines contained 16% ethanol. However, at 15% ethanol, the growth of the different strains varied. For example, strain “I1a” could grow more rapidly at this ethanol concentration when temperatures were at 64.4°F and 69.8°F, when compared to strain “F3”.
Non-Saccharomyces yeasts and wine quality. Currently, research is underway using non-Saccharomyces yeasts isolated from Washington grapes (i.e., C. californica, C. oleophila, Mt. pulcherrima, My. caribbica, My. guillermondii, or W. anomalus) in wine production. Using a Chardonnay grape must, the growth and metabolism of these different yeasts are being evaluated. The yeasts reached populations in excess of 107 cfu per mL but did not completely metabolize glucose or fructose like Saccharomyces. Additional studies that are combining both non-Saccharomyces inoculations, followed by Saccharomyces inoculations 23 days later are underway in an effort to understand how these dual inoculations improve sugar metabolism in the musts, and wine aroma and mouthfeel.
Publications
- Umiker, N.L., et al. 2013. Removal of Brettanomyces bruxellensis from red wine using membrane filtration. J. Food Proc. Pres. 37: 799-805.
- Sturgeon, J.Q., J.C. Bohlscheid, and C.G. Edwards.2013. Effect of nitrogen source on yeast metabolism and H2S formation. J. Wine Res. 24: 182-194.
- Zuehlke, J.M. and C.G. Edwards. 2013. Impact of sulfur dioxide and temperature on culturability and viability of Brettanomyces in wine. J. Food Prot. 76: 2024-2030.
- Schopp, L.M.,et al. 2013. Metabolism of non-esterified and esterified hydroxycinnamic acids and esters in red wines by Brettanomyces bruxellensis. J. Agric. Food Chem. 61: 11610-11617.
- Zuehlke, J.M., D.A. Glawe, and C.G. Edwards. 2014. Efficacy of dimethyl dicarbonate against yeasts associated with Washington State grapes and wines. J. Food Proc. Pres. (In press).