VEEN is curated by WSU Viticulture Extension. For questions on articles, or to request to submit an article in future issues, reach out to Michelle Moyer.
This issue of VEEN was originally published as a .PDF in September 2015, and posted online. Some content here will differ from that original issue. The issue is archived, but accessible on the VEEN Archive webpage.
A Note from the Editor
In a normal year, this issue of VEEN would be written prior to the start of the harvest season. In a normal year, viticulturists and winemakers alike would have had the month of August to prepare for the incoming vintage. In a normal year, we would have a month before irrigation water would be turned off. But, this year has been anything but normal. The early start (March budbreak!!??) was matched with equally early flowering and fruit ripening. We were all shocked by 24 brix Cabernet Sauvignon at the end of August, and varieties that are normally quite disparate in harvest timing are practically falling on top of each other. The light at the end of the tunnel is that this harvest season will likely end early, providing us with a prolonged “catch-up” period before next spring.
Hopefully, this prolonged period also comes with average temperatures and above average precipitation. It will be a welcomed relief to look west and see snow on Mount Adams once again. Here’s to an efficient harvest, and a snowy winter!
Happy reading, and happy harvest!
Michelle M. Moyer
Viticulture Extension Specialist
Assistant Professor of Viticulture
WSU Prosser IAREC
Table of Contents
Connect With Us
V&E Certificate Program
AgWeatherNet Updates
By Nic Loyd, Meteorologist, WSU AgWeatherNet
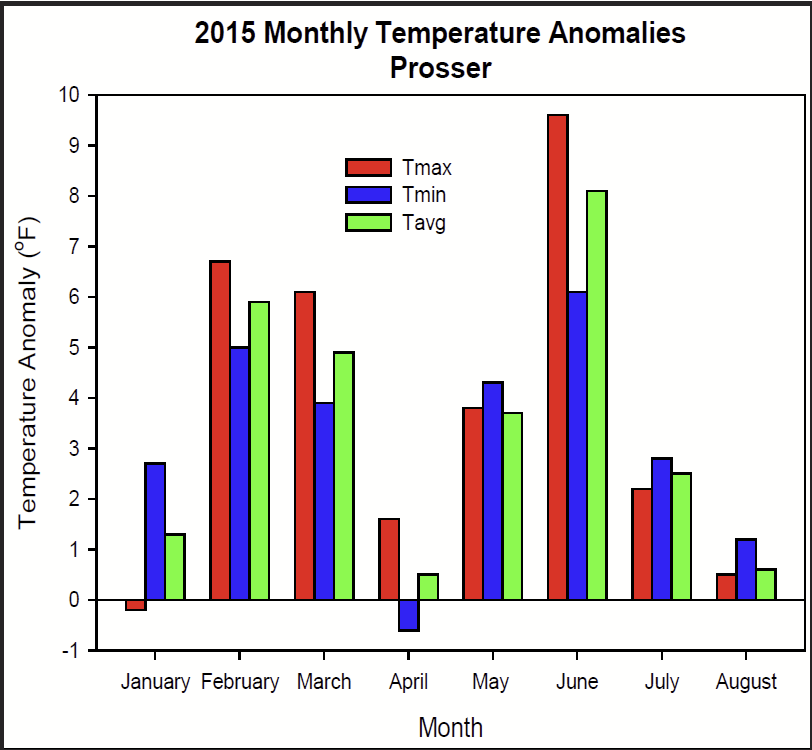
The summer of 2015 quickly relieved 2014 of its title as warmest on record in central Washington. Prosser was 3.7 degrees above normal for the season (June to August), while Tri-Cities had an average summer high of 93.3°F. June was warmer than August for only the second time and was the warmest month (relative to normal) on record.
The Tri-Cities recorded 22 days above 100°F, including a scorching 113°F on 28 Jun. On 9 Jul., Whitcomb Island ended a 14-day stretch with highs above 100°F. Numerous locations across central Washington recorded soil temperatures (at 8”) in the 90 to 95°F range in early to mid-July due to the long duration of excessive heat. These abnormally high soil temperatures represented a reserve of subsurface heat.
As of 8 Sept., 2015 accumulated Growing Degree Day (GDD) value for Prosser (starting 1 Apr.; base 50°F) was 2670 units, which is well above the 2008-2015 average of 2272 units. In a broader sense, this growing season has been a continuation of the prolonged and nearly unprecedented warm pattern that began more than a year ago (Fig. 1).
At the same time, rain has been limited, even by summer standards. Prior to 6 Sept., the last rainfall at the WSU-Tri-Cities weather station had been 25 May. Periods of blowing dust added insult to injury, including a wind event on 14 Aug. which closed Interstate 90 near Vantage.
In late July, Prosser experienced a summer 2015 rarity: a cool day. Temperatures on 26 Jul. were nearly 10 degrees cooler than average, with a high of 77°F. While that may not seem like a major departure from normal, at that time it was the coolest day relative to normal in nearly 7 months. In fact, from January to August, days that were warmer than normal by 5+ degrees outnumbered days that were 5 degrees cooler than normal by more than 10:1.
A major pattern change at the end of August served as a timely and welcome breath of fresh air, with cool and unsettled weather persisting well into early September. The regime shift began with an abnormally strong summer storm passage on 29 Aug., which delivered wind gusts of over 30 mph and blowing dust to the region. Although central areas experienced little rainfall, the higher humidity and air mass exchange helped to improve the air quality and clear the smoke. The high at the Tri-Cities on 6 Sept. was 70°F, which was their coolest high since 13 May. Meanwhile, Walla Walla’s 5 September rainfall of 0.84 inches was also the largest daily rain value since 13 May.
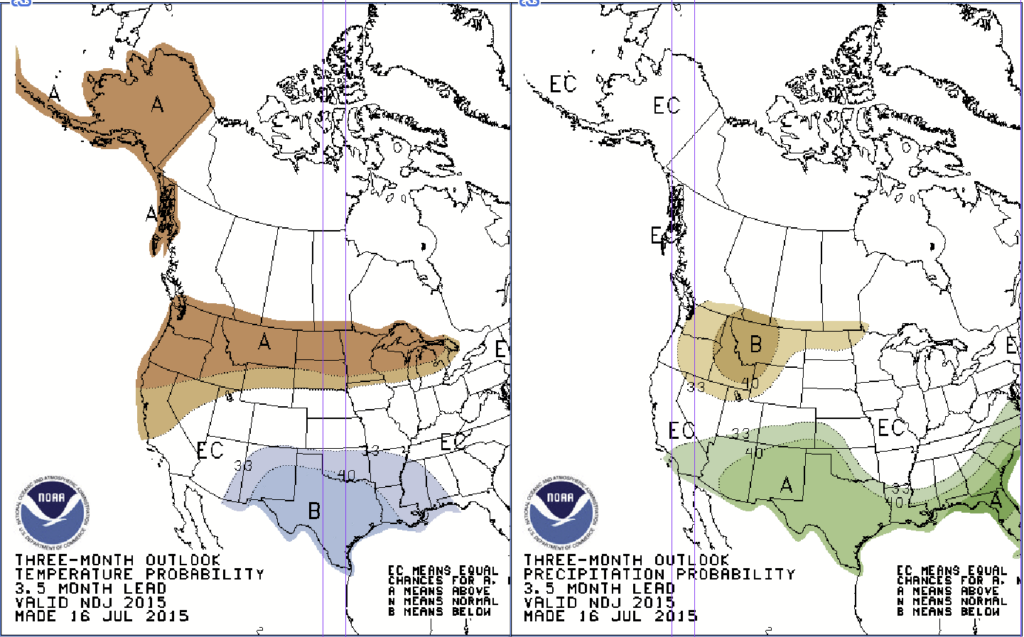
Looking ahead to the cold season, we are faced with grim prospects. Rarely have all available climate signals pointed so consistently in one direction as they do this year. Unfortunately, that direction is toward another warm and low snowpack winter. Many climate indicators, including various dynamic and statistical models, continue to suggest enhanced odds of warmer and somewhat drier than normal conditions through mid-2016. Recent observations indicate a strong and strengthening El Niño, and forecasts suggest a significant likelihood (95%+) of El Niño persisting through next winter.
If there is a silver lining in our present bleak situation, it is that strong El Niño events are generally followed by a shift toward neutral or even La Niña conditions for the following winter. Even if 2015/2016 becomes another lost winter, we can hope for better snow returns in 2016/2017, since history will be on our side. Statistically speaking, 2015 is very likely rock bottom in terms of persistent heat and lack of snow, which means that conditions can only improve as we approach the latter part of this decade.
In other words, we can hope with some justification that the climate pendulum will start to swing back in our favor later in 2016.
Further details about Washington’s weather and climate are available at AgWeatherNet.
Water Supply Resources and Reports
By Michelle Moyer, WSU Prosser
Will it be a white winter for Washington? While the long-range forecast suggests below normal precipitation and above normal temps, it could still be anyone’s guess. More critically, however, is whether our historically low snow pack will be replenished in time for next spring.
As we head into winter, WSU Viticulture Extension wants to make sure all readers are aware of the various resources that are available to track the developing snowpack situation as we move into next spring. Below is a list of resources you might find helpful:
- NOAA Climate Information: The National Oceanic and Atmospheric Administration (NOAA) is a great resource for climate data, forecasts and models. You can find short to long-range forecasts for temperature and precipitation, like those presented in Figure 1.
- NRCS Snowpack Reports: This file directory site lets users download the most recent report from the USDA Natural Resources Conservation Service (NRCS) regarding snowpack and water supply conditions. Newer reports are posted at the bottom of the page.
- AgWeatherNet: AgWeatherNet boasts weekly weather Outlooks, as well as options to sign up for weather alerts. Links to the Office of the State Climatologist, who collects information on snow depth, stream flow, and cloud coverage.
- WSU Viticulture and Enology Irrigation Webpage: The WSU Viticulture and Enology Program maintains a list of Quick Links, including many of the above, for a convenient, central location for users to access information.
A New Technique for Estimating Crop Coefficients
By Jason Stout, WSU Post-Doc, and Joan Davenport, WSU Prosser
Determining how much water to apply to a vineyard at any given point in the growing season can be quite difficult. The amount of water necessary to replenish what was lost due to environmental factors, such as evaporation, and what the plant took up from the soil need to be determined before applying irrigation. However, there is disagreement over the best way to calculate the amount of water used/lost in wine grapes.
Evapotranspiration (ET) is used as a standard estimation of water loss from soil and plant surfaces. There are two reference crops used to calculate ET: grass (ETo) and alfalfa (ETr). ETo and ETr are both calculated using the Penman Monteith equation, which integrates multiple environmental factors including air temperature, humidity, solar radiation, and wind speed, to determine water loss over a surface (1). Given the same environmental conditions, the value for ETo is typically smaller than ETr because grass has a smaller canopy area and loses less water than alfalfa. Historically, when determining the amount of water used by wine grapes, a crop coefficient (Kc) is applied to ETo (2) to better reflect the crop specific ET (ETc). The Kc value for grapes is typically less than 1, indicating that the ETo over-estimates the water need for grapes.
Crop coefficients are highly correlated with the size of the canopy and change throughout the growing season as the canopy develops. Differences in trellising and management practices (e.g., leaf removal) alter the Kc by changing the percent of the canopy exposed to direct sunlight (2). Currently, there are two methods used to determine the Kc for grapes, a varying-rate Kc that is dependent on the accumulation of growing degree days (3) and a single crop coefficient approach (1). Unfortunately, both of these techniques are generalized and do not take into account site specific conditions that might alter vine water use, such as varietal differences and canopy management practices.
While considering all of these site specific conditions would make determining Kc challenging for day-to-day operations, we evaluated a method that considers one of these aspects: canopy management. In our research, we looked at the shaded area under the vine to help calculate Kc. Direct measurements of the shaded area under the canopy takes into account site specific variables, such as trellising system, variety, and canopy management, to provide a site specific Kc. This technique was designed to both simplify and improve the site-specificity of Kc calculations.
We utilized an instrument developed by UC-Davis (4) called a Paso panel to measure the shaded area under the vines. This instrumented was initially developed to support wine grape irrigation water management in the Paso Robles area of California. Step by step instructions on the theory, construction, and operation of a Paso panel can be found at the UC-Cooperative Extension San Luis Obispo County website (4).
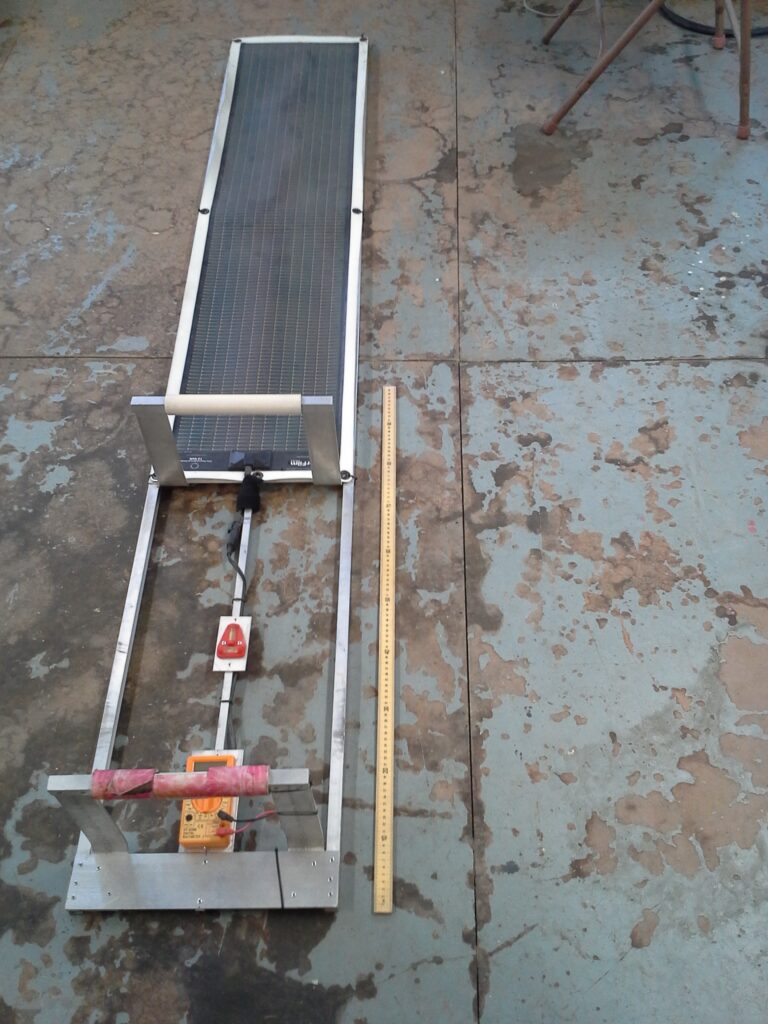
We constructed a Paso panel as seen in Figure 1. The output of the solar panel is directly proportional to the shaded area of the panel. Thus, the shaded area of the panel can be calculated by comparing the maximum output from the panel (full sun) and the average shaded output of the panel. The shaded area of the panel is then used to calculate the shaded area of the field using vine and row spacing. However, the shaded area cannot be directly used to determine Kc; research conducted by Williams and Ayars (2) in Thompson Seedless grapes has shown that the Kc, as determined by a weighing lysimeter, correlated with the percent shaded area at almost a one to one relationship. In addition, because the Kc and shaded area did not correlate perfectly, it is necessary to use the following equation to determine the Kc: Kc = (0.017 x shaded area) – 0.008.
It is important to take multiple readings with the Paso panel within a vineyard to account for canopy variability. It is also important to sample from different locations within a field/block, and from vines with canopies of all sizes. This helps to eliminate any unintentional bias that would occur if only “average” vines were chosen. Additionally, we recommend taking weekly measurements. Smaller time intervals are possible and would improve the accuracy of the technique, but environmental and time constraints rarely allow for daily measurements.
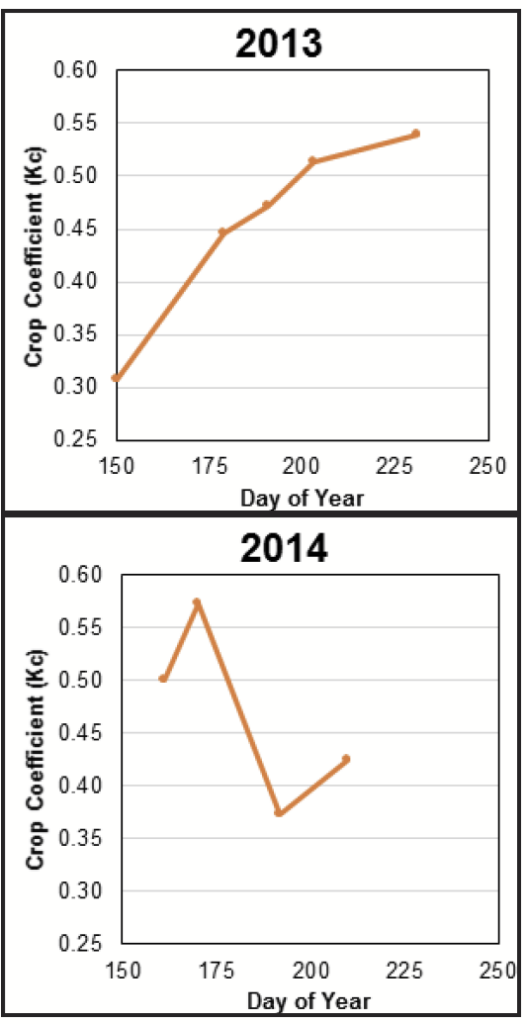
Using the shaded area technique accounts for changes in canopy structure. Figure 2 illustrates the changes in shaded-area Kc as canopy shape changes. In 2013, the Cabernet Sauvignon canopy was allowed to sprawl throughout the measurement period, however, in 2014 the catch wires were raised in the middle of the measurement period decreasing the Kc sharply (5). This type of change in canopy architecture is not taken into account in a varying-rate Kc approach.
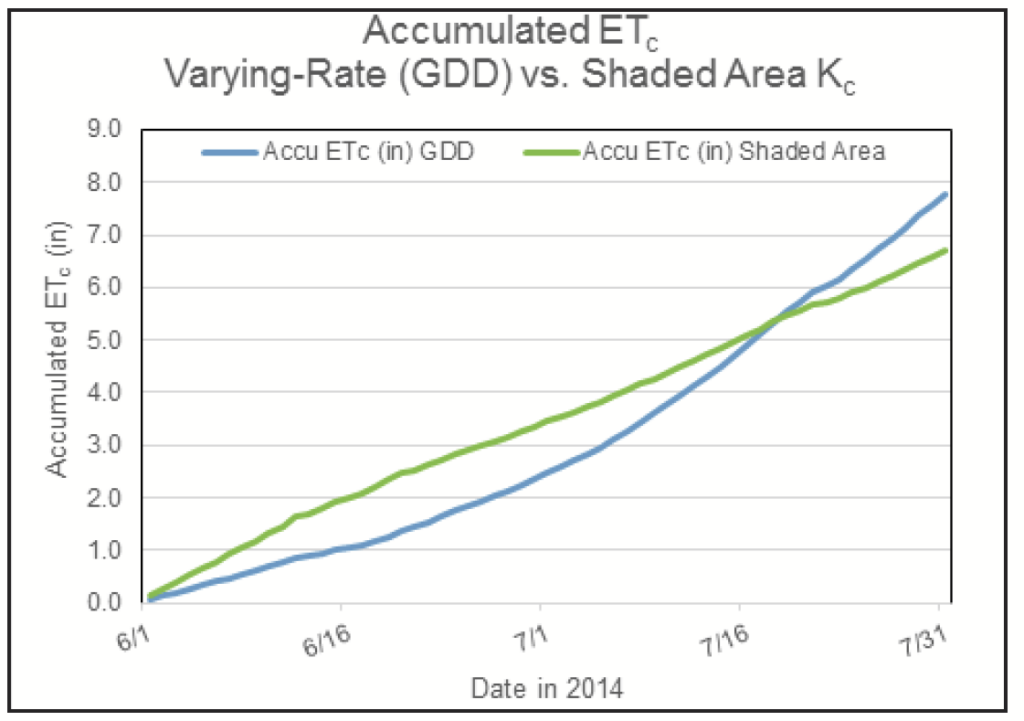
So how does the shaded area technique directly compare to the varying-rate Kc in a vineyard? In Figure 3, the accumulated ETc, with both a varying-rate Kc and the shaded area Kc applied, are compared at the same site. Across June and July, the varying-rate method underestimated the ETc relative to the shaded area method until the middle of July. Then in mid-July, it increased dramatically, ending July by overestimating ETc by approximately 1 inch relative to the shaded area method. Interestingly, the over-estimation occurred during a period when the canopy had stopped growing, and when area growers had started applying regulated deficit irrigation (RDI). While full-sized canopies do lose the most water, they also become more water efficient as a result of RDI exposure. This may indicate that using the varying-rate Kc calculation might result in over-estimation of water use in mid-season, and thus, result in an over-application of irrigation during a time when growers are attempting to induce a deficit.
The Paso panel is a simple tool that can be used to easily estimate the Kc for vineyards with differing canopies. This gives a tailored calculation of the water needed based on canopy growth rate and architecture, rather than solely relying on site-specific temperature. If irrigation scheduling has been challenging at your site using the standard methods of crop water use calculations, then using the shaded area may help improve your irrigation management.
References
- Allen, R.G., L.S. Pereira, D. Raes, and M. Smith. 1998. FAO Irrigation and drainage #56. FAO, Rome 300: 6541.
- Williams, L.E., and J.E. Ayars. 2005. Agricultural and Forest Meteorology. 132: 201–211.
- Evans, R.G., S.E. Spayd, R.L. Wample, M.W. Kroeger, and M.O. Mahan. 1993. Agricultural Water Management 23: 109–124.
- Battany, M. 2006. Crop coefficients – Paso panel.
- Stout, J.E. 2015. Ph.D. Dissertation, Washington State University, Pullman.
Concord Chlorosis
By Joan Davenport, WSU Prosser
We have all seen it. Concord vineyards with large patches of vines that are bright yellow (Fig. 1). It shows up around bloom, generally in June. What causes Concord chlorosis, and is there anything that can be done to prevent it?
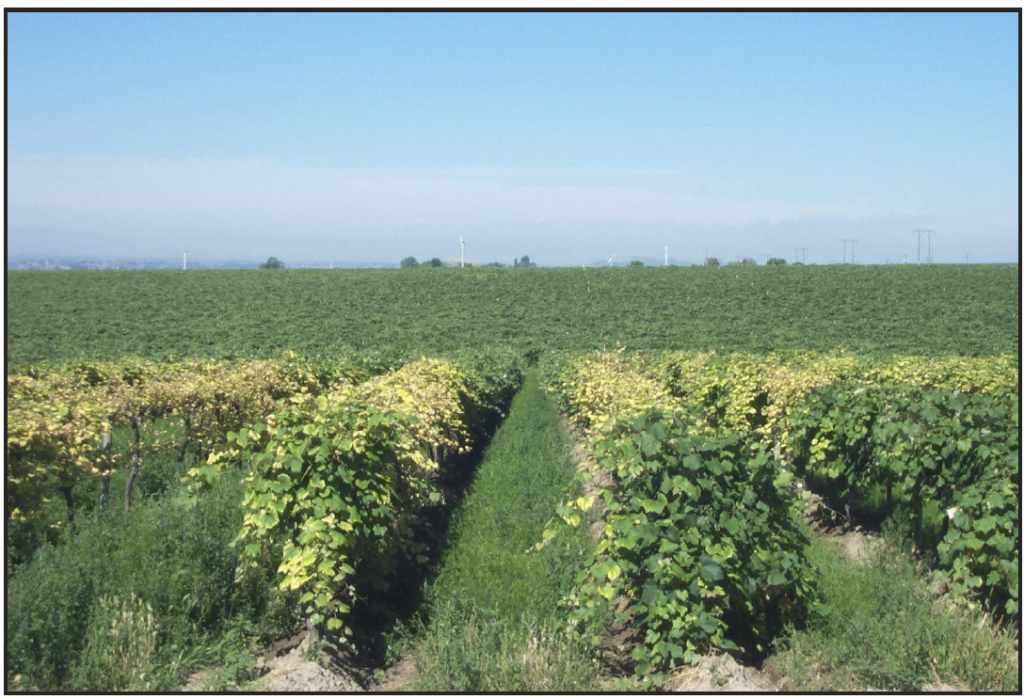
Concord chlorosis in central Washington is not new. Viticulturists, soil scientists, growers, and anyone who has an interest in growing Concord grapes in this region has tried to find a way to make it go away. Over the years, we have discovered a lot about what causes it, but unfortunately, we have not found consistent ways to prevent it. Thus, we still see chlorotic areas in Concord vineyards year after year.
The disorder is often referred to as “lime-induced chlorosis”. In part this is in relation to the high levels of naturally occurring calcium carbonate (yes, limestone) in the soils in this region. The general concept is that the high levels of calcium, which are often associated with higher soil pH, reduce the availability of micronutrients in the soil. It is well documented that most plant micronutrients have lower availability in higher pH soils.
The general belief is that Concord chlorosis is a result of lack of plant available iron. Work by Cornell University (1) has shown that chlorotic leaves have lower amounts of biologically active iron in them, although there is more than enough total iron available.
Numerous things have been tried to remedy chlorotic zones including soil additives to lower the soil pH. Chelated iron has been added to the soil or applied to vine leaves as foliar sprays. Soil additives that have microbiological properties or enzymes intended to “unlock” soil nutrients have also been tried. Most of these treatments work either a little or very effectively with one serious flaw: while the vines may turn green for the growing season in question, chlorosis is back the next year.
The most effective annual tool that we have found is to add a very specific chelated iron to the soil in the spring. The material, iron EDDHA, should be soil applied twice in the spring, once near bud burst (late March / early April) and again in May, each time using 30 lbs/A of the material.
The greatest dilemma with this is the material cost. One way to reduce overall costs would be to apply it to only the areas of the vineyard that have had issues with chlorosis in the past. However, this would require mapping the extent of the chlorosis and using application equipment that can turn on and off as needed.
Soil pH may not be the only factor that influences the development of Concord chlorosis. Work conducted in central Washington (2) showed that chlorotic areas in vineyards are in locations where the soil is cool and wet in the spring.
The area of the vineyard displaying chlorotic symptoms shrinks in warm dry springs and expands in cool wet springs, or when soils are kept wet with irrigation early in the season. This information suggests that closely monitoring the extent of Concord irrigation in the spring, and perhaps remedying any poor-drainage in the vineyard may help reduce the extent of chlorotic symptoms.
Is there a longer term solution? Some have suggested rootstocks, which may be an answer. Some have suggested trying to lower soil pH, although past attempts have not been successful. Currently we have a research project evaluating different cover crops that generate compounds known a siderophores, which, when excreted into the soil, may increase the amount of iron for the vines and reduce chlorosis. More details on this project will be forthcoming. Until then, annual management will still be required if chlorosis is severe enough to cause a reduction in yield or a delay in sugar accumulation.
References
- Smith, B.R. and L. Cheng. 2006. HortScience 41:1498-1501.
- Davenport, J.R., and R.G. Stevens. 2006. HortScience 41:418-422.
Evaluating Craftsmanship in Wine Barrels
By Tom Collins, WSU TriCities
The manufacturing process for wine barrels includes several steps which are critical to barrel quality, including selection and seasoning of the oak, milling of the stave blanks into production staves, raising of the barrel, bending the raised barrel, toasting the barrel and finally finishing of the barrel. In each step, cooperages have or should have quality control procedures in place to ensure correct craftsmanship and that defects are identified and corrected at each step. However, in practice, this does not always occur. The following is a plan to help wineries design their own barrel quality evaluation program.
A typical evaluation program for barrels is a visual inspection of the barrel exterior when it is delivered. This includes comparing the toast level stamped on the barrel to what was ordered and an inspection of the interior through the bunghole using a flashlight. A quick sniff to detect off aromas is often done. Approved barrels are then sent off for a quick rinse.
A more comprehensive evaluation program to catch defects or inconsistencies should include the visual inspection of the exterior as before, but should also include removing the head from a sample of barrels to do a more thorough visual inspection of the interior. It might also include collecting a sample of wood from the interior for chemical analysis of the toasted wood composition. With appropriate coopering tools, the process of removing the head, conducting a visual inspection, collecting a wood sample and then replacing the head takes no more than 15-20 minutes per barrel. For the remainder of this article we will focus on removing the barrel head and conducting a visual inspection of the barrel interior.
The process of removing the head starts with removing the hoop nails that ostensibly hold the hoops in place. This can be the most time consuming part of the process. After removing the nails, the following is done:
- Working from the center of the barrel outwards to the head, use a hoop driver and a coopering hammer / small sledge hammer to loosen and remove hoops;
- When the last hoop remains, place one of the removed hoops back onto the barrel as this will reduce the pressure on the outer hoop making it easier to remove;
- Remove the outer hoop, followed by the loose support-hoop;
- The head will either drop to the floor, or can be removed by tapping lightly on the ends of each stave, until the head is released. With practice, you will usually be able to catch the head as it releases, but if it falls into the barrel, simply invert to remove.
To start the inspection process, begin with the barrel head. Figure 1 shows a barrel head with inconsistent milling and toasting. Notice the color differences within and between the staves. The darker staves are often not milled as smoothly as the lighter staves or areas. Often these staves or parts of individual staves are thinner than adjacent areas, so when they are passed through the planer during the milling process, the stave is not planed smooth. These rougher surfaces absorb more heat and toast more quickly than the smoother areas which are better at reflecting heat.
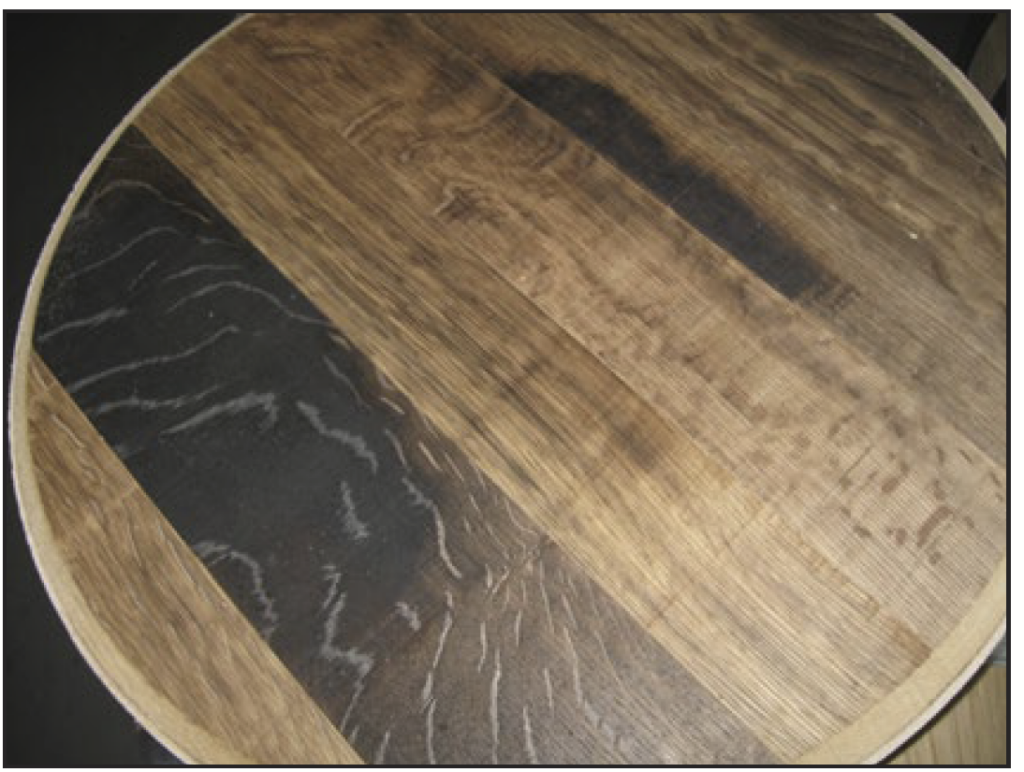
The same issue can occur with the staves that make up the body of the barrel, as seen in Figure 2. In this image, you can see a stave that has a darkened areas on both outside edges. This stave was not of uniform thickness, and therefore, a part of the wood was not planed smooth. The end result is the same as in the barrel head, in that part of the stave is more heavily toasted than the rest. Additionally, due to these differences in thickness, there is a lip where the stave abuts the adjacent stave, creating an area where lees can accumulate during the aging process, making this area more difficult to properly clean.
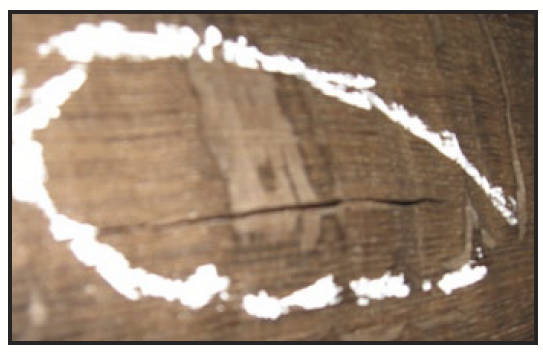
Other defects, such as blisters in the wood (Fig. 3), are difficult to see during the typical inspection through the bunghole. Blisters can form during the toasting process when the barrel is heated too quickly. Moisture in the wood, which normally can escape through the ends of the stave can create blisters in the stave if heated to boiling before it can escape. The chalk circle on this stave is the area affected by the blister. The steam can sometimes escape through the side of the stave as well, resulting in a raised area at the stave edge, without an obvious rupture. Blisters can also provide an area where lees can accumulate, making it difficult, if not impossible, to properly clean.
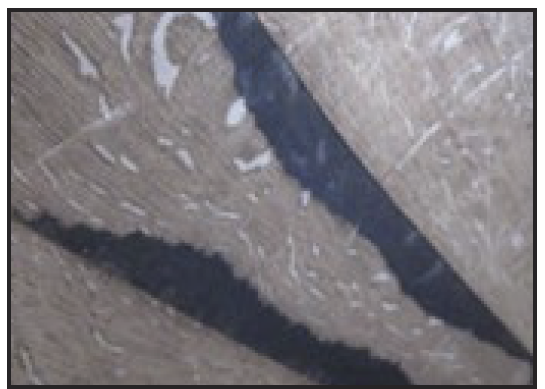
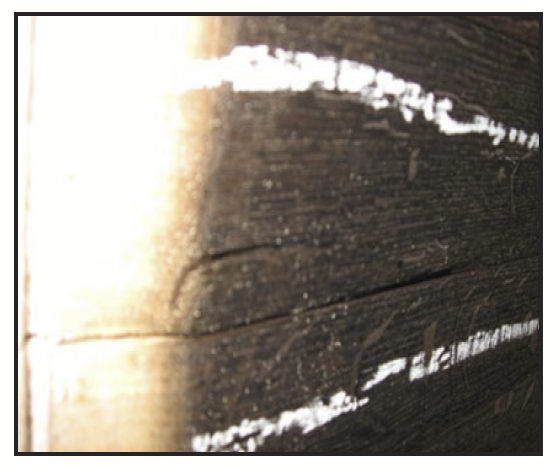
In some instances, cracking or delamination of staves can also occur (Fig. 4). These types of defect can occur during the finishing process and can be more common on more heavily toasted barrels. In the case of Figure 4, the damage probably occurred during the routing of the croze; if the router blade is not sharp, it can cause chipping or cracking resulting in an area where lees can accumulate. In Figure 5, the cracking was severe enough that a piece of the stave broke off during the process. Similarly, chipping can also occur around the bunghole.
All of these defects should be visible to the cooper doing the work and these staves should be repaired or replaced prior to the next step in the coopering process. In most cases, these are addressed. If these or similar defects are found during your visual inspection, you may want to bring them to the attention of the sales representative for the cooperage. Cooperages are interested in making sure that you are satisfied with your purchases and that they are delivering the best barrels they can produce.
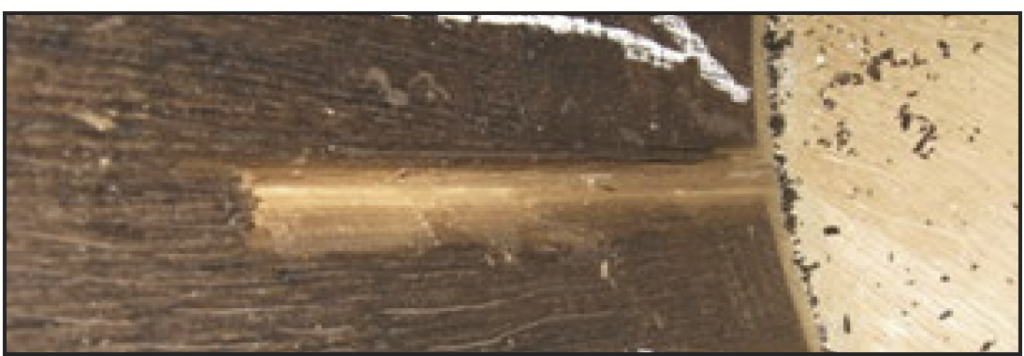
Last, but not least, once the inspection of the interior of the barrel is complete, the head can be reinserted with the aid of the tool shown in Figure 6, which was made from a short piece of electrical conduit. Typically, the head is inserted into the barrel, then one edge is caught in the croze. The conduit tool is then inserted through the bunghole and is used to drive the head into place in the croze. It is helpful to have a second person assist by using a short piece metal with a small lip at one end to support the far side of the head while you use the conduit tool to persuade the head to slip into the croze. Once the head is back in the croze, the hoops can be replaced, working from the outside towards the center, using the hoop driver and a hammer to set the hoops firmly in place.
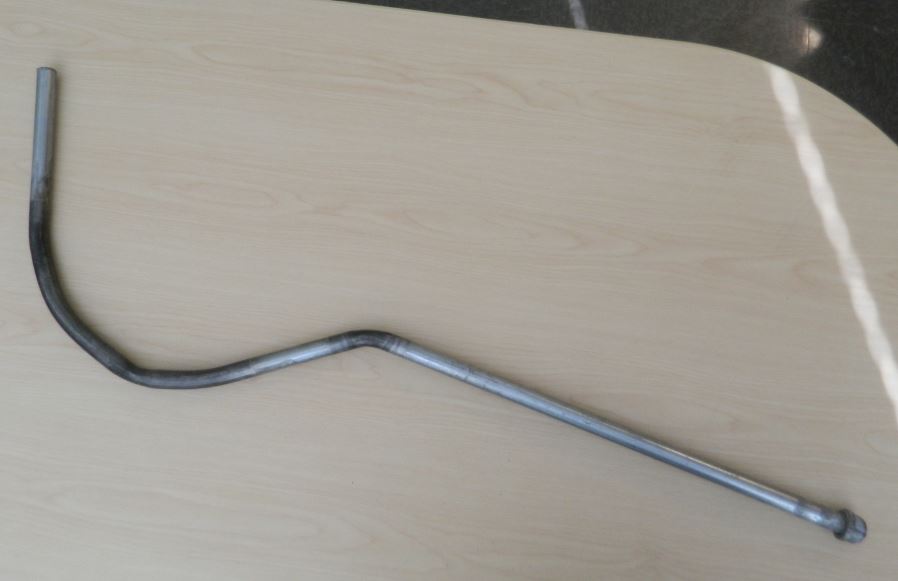
Barrels are a significant investment; consider an inspection program for the next vintage using the methods described here!
Adjusting Acidity in a Hot Vintage
By Jim Harbertson, Richard Larsen, and Thomas Henick-Kling, WSU TriCities
This year is shaping up to be one of the hottest on record, so in preparation winemakers are getting ready for fruit with high soluble solids and low acid to arrive in their wineries earlier than usual. To help with this situation, this article will outline some of the basic methods for acidulating juice and/or wine.
Wine and Grape Acidity
Acidity is fundamental in grape and wine composition. Acids are the second most abundant component in grapes and correspondingly in wine. Sensorially, acids are sour, can augment astringency and their sourness is masked by sugars. From a chemical standpoint, they are responsible for slowing microbial growth, selectively inhibiting some microorganisms, stability of wine, grape protein solubility, and controlling chemical reactions. Acids take part in esterification reactions, catalyze hydrolytic reactions and impact red wine color.
Grapes accumulate a mixture of weak organic acids but the two most abundant acids present are tartaric and malic acid. Tartaric acid is not metabolized by the grape and can only metabolized oxidatively by some microorganisms (i.e., not under standard winemaking conditions), while malic acid is metabolized during grape ripening, and is also consumed during fermentation by lactic acid bacteria and in very small amounts by yeast. During hot years like the 2014 and 2015 vintage much of the malic acid will be metabolized in the berry prior to harvest.
Why do we Measure Titratable Acidity and pH?
Titratable acidity and pH are the most commonly practiced basic measures of acidity. The main measure of acidity is pH, which is an equilibrium measure of the protons in the sample and is affected by the degree that acids are neutralized. pH is a log scale, which results in single unit differences equating to ten-fold differences in concentration. Titratable acidity is determined by titrating the wine to a chosen pH end point (in the US pH = 8.2) and represents the total number of acids in the wine. So why measure both titratable acidity and pH? While the two pieces of information are essentially measuring the same thing and should be fundamentally related to each other, in both grapes and wine, this is not always the case.
As stated earlier, pH can be viewed as a means of evaluating the extent of the neutralization of the acids that are present in the grape. The pH of purified organic acids in water from 1 g/L to 10 g/L can be found in Table 1. It is important to note that this is just an illustration of the difference, as in grapes you have several organic acids present, however the more important aspect is that at 5 g/L tartaric acid the pH would be 2.24. Typically fruit that is harvested with 5 g/L tartaric would have a pH close to 4.0. In grapes the protons could be neutralized by either being exchanged for potassium or consumed as part of the metabolism of malic acid.
| Tartaric Acid (g/L) | pH |
|---|---|
| 1 | 2.58 |
| 2 | 2.44 |
| 3 | 2.36 |
| 4 | 2.28 |
| 5 | 2.24 |
| 6 | 2.20 |
| 7 | 2.17 |
| 8 | 2.14 |
| 9 | 2.11 |
| 10 | 2.09 |
The other rather important aspect of why we measure titratable acidity is that it relates to our perception of astringency better than pH does.
Changing Titratable Acidity
Changing titratable acidity requires some empirical work. Each grape juice and wine will have its own buffering capacity, and ionic strength due to the mixture of acids, and in the case of wine, ethanol, will alter the disassociation constants of the organic acids making it difficult to mathematically predict titratable acidity or pH shifts in wine when additions are made. It is easiest to do a bench trial of the various acids you are considering adding to your wine (see Fall 2014 VEEN article on Winery Bench Trials). Typically adjustments are done in a stepwise fashion, added in small doses.
Changing pH
Changing wine pH is very difficult to achieve by simply adding organic acids. Small shifts can be typically achieved (0.2 units) during winemaking due to undergoing malo-lactic fermentation and much the same can be achieved due to adjustments in the winery. Although large shifts can be targeted, the amount of acid required to make the adjustment would render the wine unpalatable. Depending on wine type and must composition, up to 3 g/L of tartaric and/or malic acid can be added to the must. More acid can be added to the wine after alcoholic fermentation. Although not widely practiced, ion exchange systems can be used to trade potassium for protons. This is the closest thing that is legally allowable to the effect of adding a strong acid, as no weak organic acid would be added during this process. Ion exchange has its strongest usage in juices as opposed to wines due to the packing material of the column interacting with some phenolics and polysaccharides which not only leads to fouling of the column but also stripping of the wine.
Tartaric Acid
The most commonly added acid to wine is tartaric acid because it is not metabolized by microorganisms in wine. Tartaric is the most abundant organic acid in grapes and wines. It is typically the first choice as an acidulant due to its grape origins. The main downside to adding tartaric acid is that the same issues with potassium or calcium salt formation remain.
Citric Acid
Citric acid is a triprotic acid (three acidic functional groups that can donate a proton) that is used in some winery sanitation programs. In production, citric acid can be added to wines to provide a crisp acidity. Contrary to some public opinion, adding citric acid will not give your wine a citrus aroma or flavor, as those aroma components are typically removed prior to sale in large plastic containers. Citric acid is found in grapes but in very small quantities.
Citric acid will also chelate iron and other metals such as potassium, calcium and copper. Unfortunately, citric acid can be easily metabolized by any wine bacteria and yeast. Thus it is not stable in wine unless a wine is sterile-filtered after the addition of citric acid. Also lactic acid bacteria favor the conversion of citric acid into diacetyl that can give wine an unwanted buttery flavor. Lactic acid bacteria can also co-metabolize citric acid and sugars, which can lead to the formation of acetic acid that can also negatively impact wine aroma.
Malic Acid
Malic acid is the second most abundant acid in wine grapes and is metabolized in the berry during grape ripening and during winemaking by both yeast and lactic acid bacteria. Similar to citric acid, it is not as commonly added to wine due to the fact that it can be metabolized. Unlike citric acid, added malic acid will not lead to the formation of diacetyl. In very warm years where very little to no malic acid will be remaining in fruit at harvest the addition of malic acid in the winery may be beneficial to improving wine texture or adding complexity as well as promoting a healthy malolactic fermentation.
It seems counterintuitive to add an acid that can be metabolized as many winemakers are trained to strive for a wine that eventually becomes a “nutrient wasteland” to ensure no refermentation occurs after bottling. The addition of acid is similar to chaptalization to achieve a target alcohol concentration, except that the target is to benefit malolactic fermentation.
As a reminder, many organic compounds in wine and grapes have asymmetric centers in the molecule (amino acids, organic acids) which means that there are different versions of the same molecule that only differ in their three dimensional configuration. The simplest example of this is the human hand. Your left and right hand are essentially identical with the exception of the configuration.
Natural sources of organic acids or amino acids will only have the (L) configuration of the molecule, however, synthetic versions of the compounds are also available that are a 50:50 mixture of the two stereoisomers. Typically the synthetic, food-grade versions are much cheaper than the natural sources.
Malic acid is available in both of its stereoisomeric versions (D or L) or as a mixture of the two. Only L-malic acid can be metabolized by wine lactic acid bacteria (and yeast). Thus D-malic acid is a stable acid in wine and other foods where it is also used as an acidulant. According to the FDA (21 CFR 184.1069 Malic Acid), you may use L-malic or DL-malic acid (TTB 27 Chapter I, Subchapter A, Part 24, Subpart F, §24.182). Unfortunately the impacts on sensory perception of sourness, sweetness or astringency of the remaining malic acid are unclear as there is no published research in this area. The addition of DL-malic acid is widely practiced in the Australian wine industry.
An important difference between malic and tartaric acid is that malic acid does not crystallize (precipitate out) with either potassium or calcium ions at wine pH. It stays dissolved in the wine.
Adjusting Earlier and Adjusting Later
The question is often asked as to when the selected acid should be added: to the must or the finished wine?
If malic acid is chosen, it should be added in wines above pH ~3.2 prior to inoculation with malolactic bacteria (MLB) to provide a ready energy source for the bacteria. Obviously, adding malic acid to a finished wine will run the risk of a spontaneous MLF after bottling unless it is sterile filtered. For wineries that depend on native fermentation by MLBs, malic acid should be added to the must at the beginning of alcoholic fermentation. In either case, it is useful to quantify the amount of malic acid in the must prior to and post fermentation to better determine the amount of acid to be added to achieve the desired result.
Addition of tartaric acid is more difficult because of the precipitation of the acid salts as potassium bitartrate as discussed above. Typically tartaric acid is added prior to primary fermentation, as less of these salts are formed at that point. If after primary and malolactic fermentation are complete it is determined sensorially or quantitatively that acidity is below that desired, tartaric acid can be added but occasionally with some difficulty.
Because of the final alcohol concentration together with the high concentrations of potassium common in Washington grapes and wine, some of the acid addition will be lost as a potassium bitartrate precipitate. It may require three or four additions to achieve the desired final acidity due to this precipitation. Bench trials (see Fall 2014 VEEN) can be useful in determining how much might be lost by experimentation. As a final note, the acids should not be added in powder form, ever, because of solubility issues.